
Figure 3.
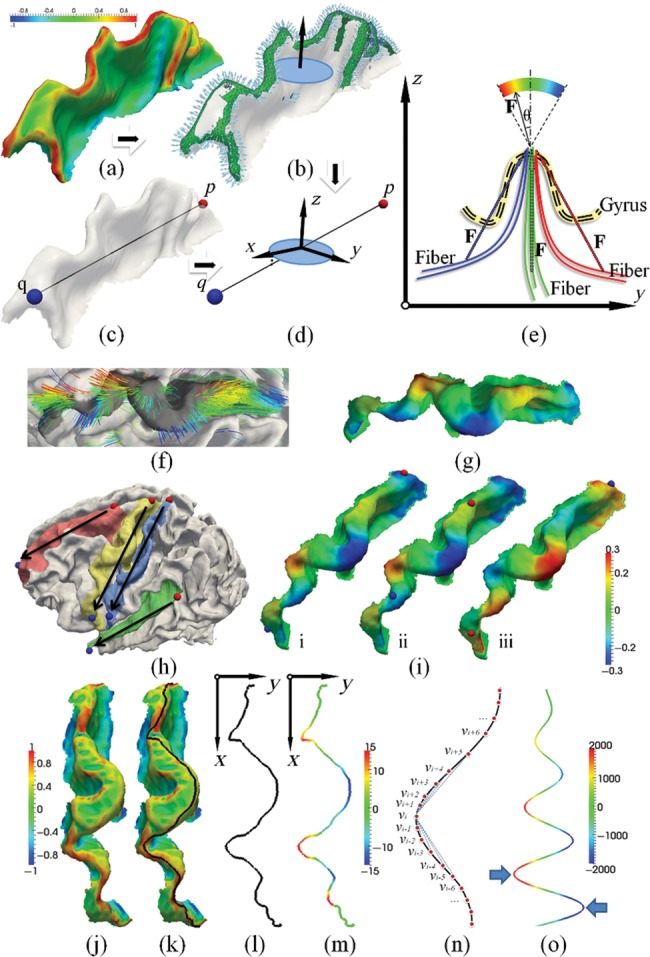
Illustration of quantification of fiber orientation patterns and gyral folding patterns in local coordinate systems constructed on the gyral crest. (a–d) Definition of gyral local coordinate systems. (a) Principal curvature of surface; (b) gyral normal vectors; (c) manually selecting 2 points from both ends of a gyrus; (d) gyral local coordinate system. (e–i) Illustration of fiber orientation patterns. (e) Definition of fiber orientation patterns in the local coordinate system; (f) examples of orientation patterns of fibers; (g) examples of mapping fiber orientation patterns onto the gyrus; (h) illustration of endpoint pair selection on each gyrus. Black arrows indicate the X-direction of each local coordinate system. The red point is the start point, and the blue point is the end point. (i) Fiber orientation patterns for the same subject with different endpoint pairs. The red point is the start point, and the blue point is the end point. Fiber orientation pattern has been mapped to the gyrus. (j–o) Illustration of the methods for the quantification of gyral folding patterns. (j) A precentral gyrus color coded by maximum principal curvature. The color bar is on the left; (k) the gyral crest curve (black line) extracted and overlaid on the gyrus; (l) the gyral crest curve projected to the local coordinate system's X-Y plane; (m) the shape pattern of the crest curve; (n) illustration of computing plane curve shape pattern; (o) folding pattern descriptor on the simulated curve:  .
.