
Figure 4.
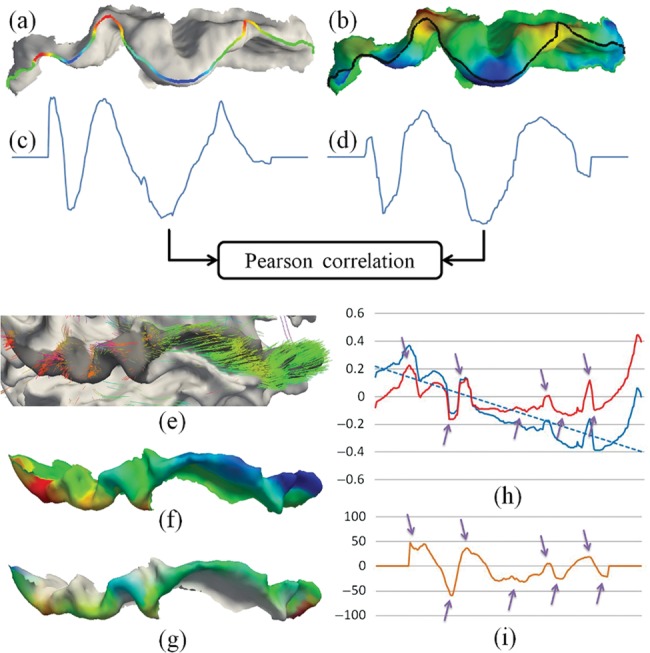
Illustration of our methods for the quantification of correlation between fiber orientation patterns and gyral folding patterns. (a) Gyral folding pattern; (b) fiber orientation pattern; (c) gyral folding pattern function curve; (d) fiber orientation pattern function curve; (e and f) an example of the global fiber orientation trend; (g) the fiber orientation patterns after de-trending; (h) de-trending fiber orientation patterns via linear model. Blue line, original fiber orientation pattern; blue dashed line, the linear model of the original fiber orientation pattern; red line, fiber orientation pattern after de-trending. The gyrus is the same as in (e–g). (i) Folding pattern description of the same gyrus in (h).