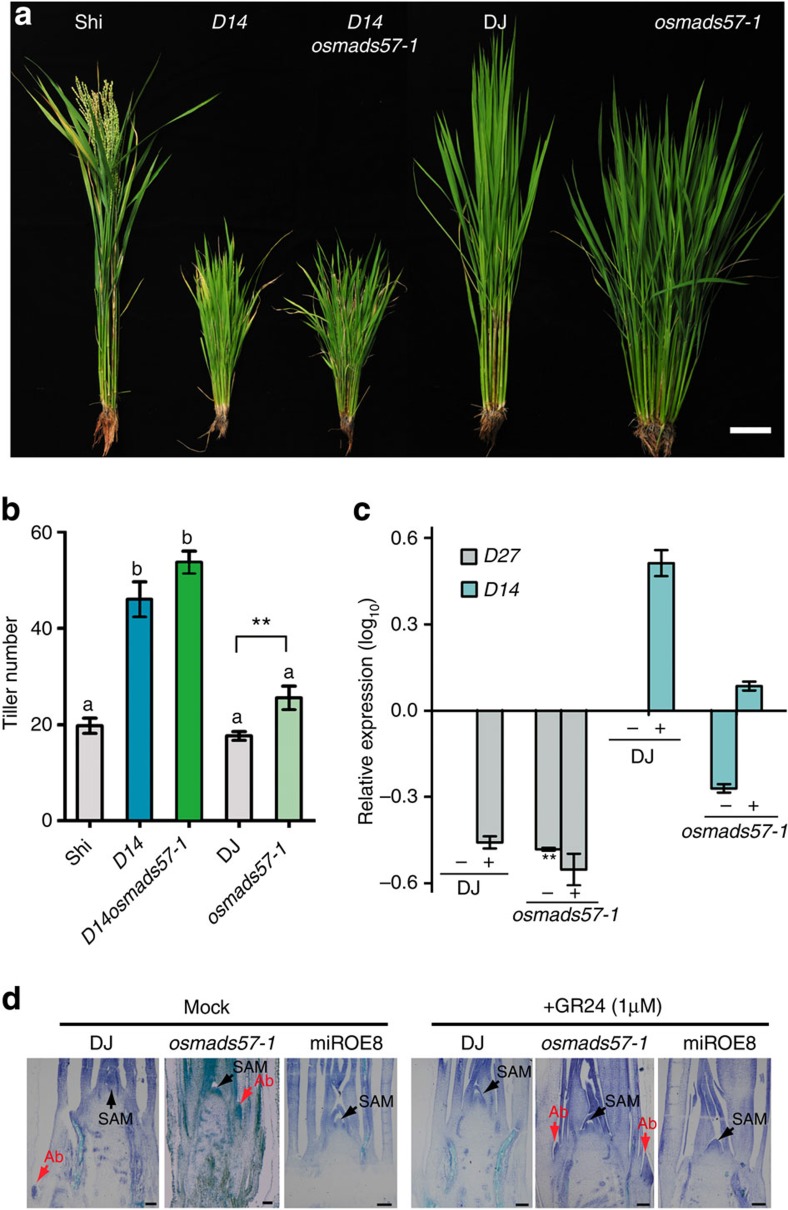
Figure 5. Double mutant d14osmads57-1 and response to GR24.
(a,b) Tiller phenotypes and tiller number at heading stage. Scale bar, 10 cm. Different letters a and b represent significant differences among the lines (the least significant difference test, P<0.05). **P<0.01 by Student’s t-test. (c) D27 and D14 expression with (+) or without (−) 1 μM GR24. (d) Longitudinal sections of shoot apex treated with 1 μM GR24. Scale bars, 100 μm.

