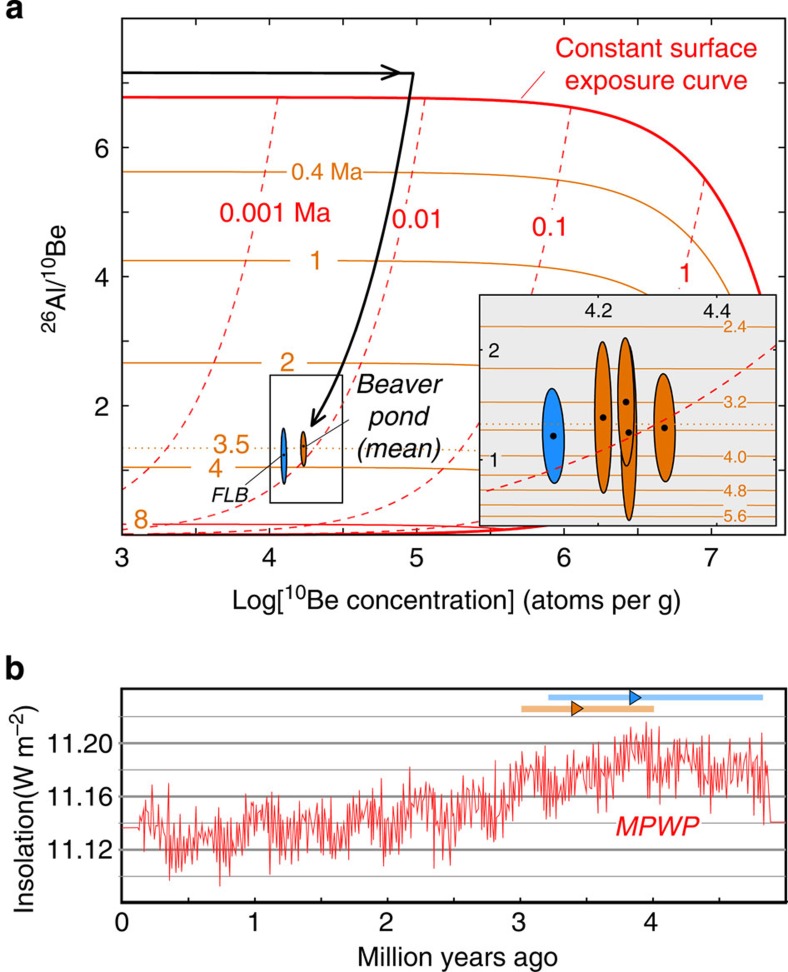
Figure 2. Geochronology of Ellesmere camel.
(a) 26Al/10Be versus log10Be plot for the five samples collected for burial dating. Black arrow illustrates a simple exposure history (minimum exposure duration indicated by dashed red lines) followed by instantaneous burial (minimum burial durations indicated by solid brown lines). Blue: Beaver Pond Site and Orange: Fyles Leaf Beds Site. The weighted mean age for all four samples of the Beaver Pond Site (shown in inset) is provided in the main graph. This graph assumes no muonic production, as discussed in text (cf. Supplementary Fig. S2). (b) Mean insolation at 78.55 N latitude for winter season (270–0 degrees from vernal) symmetrically smoothed (25 pts) with simple moving window averaging using FFT43,44. The maximum-limiting and minimum-limiting ages with 1 σ total error bars are shown above. MPWP, Mid-Pliocene Warm Period; FFT, Fast Fourier Transform.

