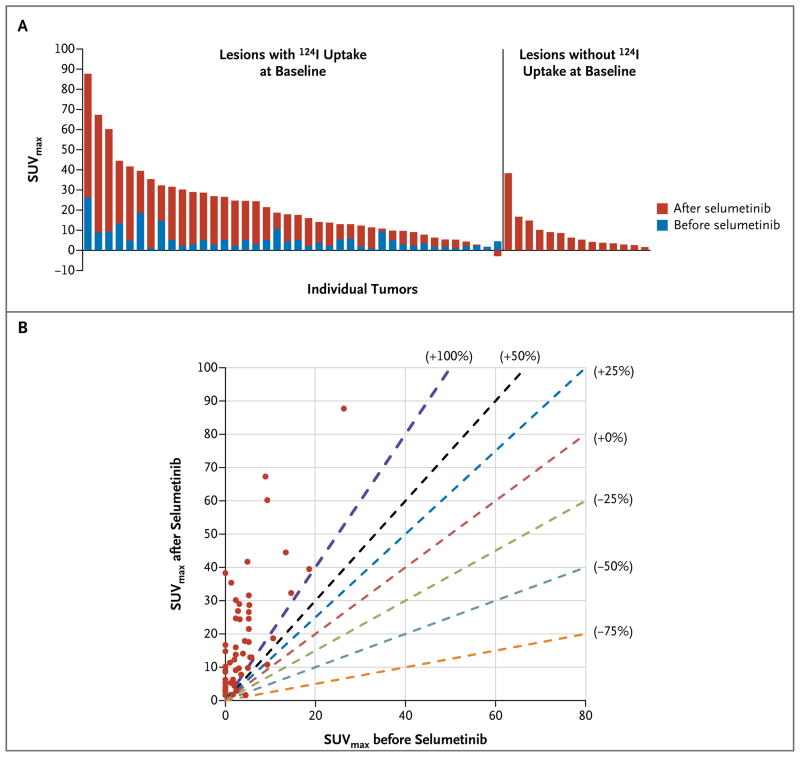
Figure 3. Quantification of Iodine-124 PET Uptake in a Lesion in a Patient with an NRAS Mutation Who Later Received Radioiodine.
Panel A shows the maximal standardized uptake value (SUVmax) for iodine in all tumors in a patient with an NRAS-mutant, poorly differentiated thyroid cancer. Each bar represents one malignant lesion identified on the iodine-124 PET-CT scan. The bars to the left indicate the increases in iodine-124 avidity achieved after selumetinib administration in lesions that absorbed some iodine at baseline. The bars on the right indicate selumetinib-induced changes in lesions that were negative for iodine at baseline. Panel B shows the SUVmax in every metastatic lesion identified in the same patient before and after the administration of selumetinib. The dashed lines mark points on the graph corresponding to different degrees of change in the SUVmax in the lesion after the administration of selumetinib. The red dashed line demarcates no change in iodine uptake after the administration of selumetinib (0%). Dashed lines to the left of the red dashed line represent graded percentage increases in iodine-124 uptake (+25%, +50%, and +100%), whereas the lines to the right represent graded percentage decreases (−25%, −50%, and −75%). Nearly all the metastatic lesions in this patient (circles) had more than a 100% increase in iodine uptake after administration of selumetinib. The SUVmax for a sternal metastasis was off the scale (it increased from 220 to 599 with selumetinib) and thus could not be included in these graphs without obscuring the data for the other 54 lesions analyzed.

