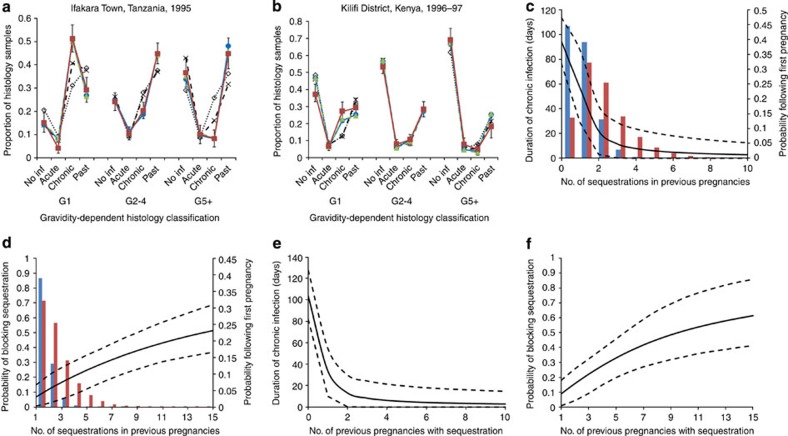
Figure 2. Final fitted models and immunity functions.
(a,b) Show the fit of the model to the placental histology data from Ifakara and Kilifi, respectively. Observed data are represented by the red lines and squares, error bars are 95% binomial confidence intervals based upon the fact that, when assuming a multinomial distribution, each individual point follows a binomial distribution. Blue lines and circles show the posterior mean of the proportion of samples in each category according to the final infection-dependent model and green dashed lines and triangles show the equivalent for the final infected-pregnancy-dependent model. For comparison, lines showing the equivalent values for the model assuming no parity-dependent immunity (dotted black line with open diamonds) and the infected-pregnancy-dependent model with only sequestration-blocking immunity (dashed black lines with crosses) have also been plotted. (c) Shows how the duration of chronic infection decreases and (d) the extent to which placental infection is prevented with increased exposure to placental infection in prior pregnancies for the ‘infection-dependent' immunity assumptions and (e,f) the equivalent figures for the ‘infected-pregnancy-dependent' assumption. For the infection-dependent figures the distributions of the number of placental infections experienced throughout first pregnancies in Ifakara (red bars) and Kilifi (blue bars) are also shown.

