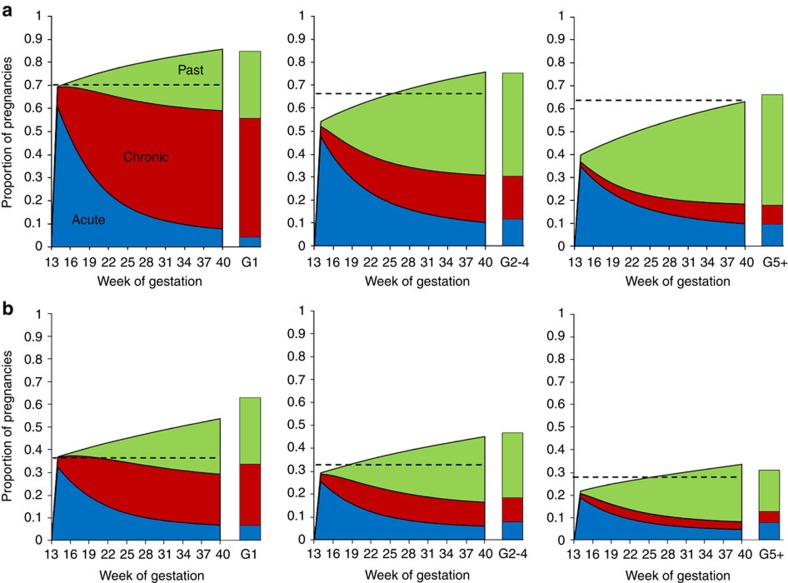
Figure 3. Estimates of the prevalence of each histological stage by week of gestation.
(a) Shows the posterior mean estimated prevalence of each stage of sequestration during each week of gestation for the Ifakara transmission setting. (b) Shows the equivalent figure for the Kilifi transmission setting. In each figure, blue areas show the prevalence of acute stage infection, red the prevalence of chronic stage infection and green the prevalence of past stage infection. In each figure, the left chart shows the estimate for primigravidae, the central chart shows gravidities 2–4 and the right chart shows gravidities 5 and above. The observed data for each gravidity category and transmission setting, as shown in Fig. 1, is presented as a column beside the appropriate chart. The age-adjusted prevalence of parasitaemia for each category is presented as a dashed black line.

