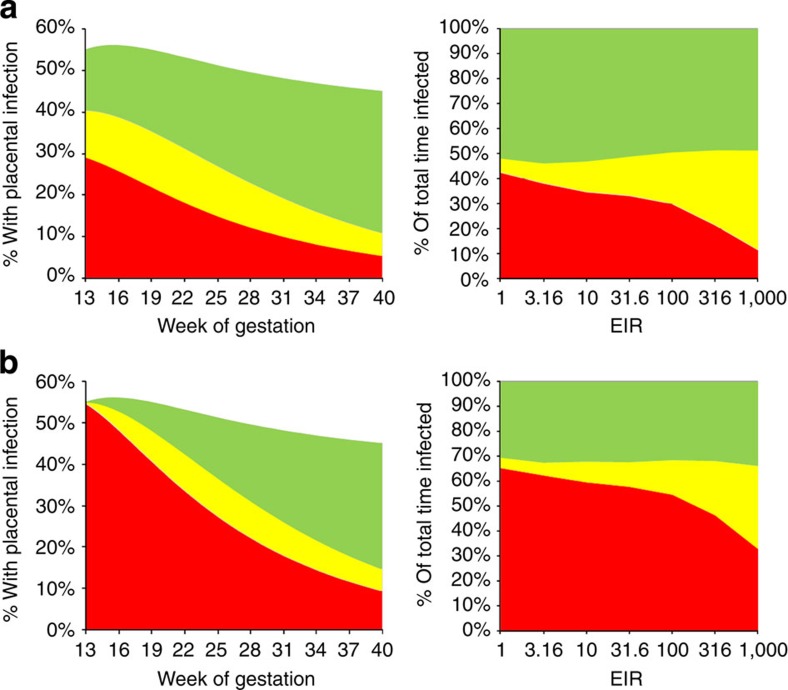
Figure 4. The impact of infection before and early during first pregnancy.
(a) Shows the time spent with placental infection during first pregnancy caused by infections acquired before (that is, <0 weeks gestation-red areas) and during (that is, ⩾0 weeks gestation-green areas) pregnancy, yellow areas show time spent with multiple placental infections caused by infection acquired both before and during pregnancy. (b) Shows the equivalent figure but partioning the prevalence of placental infection according to whether placental infection is due to infection acquired before the placenta first becomes susceptible to infection (that is, <12 weeks gestation), with yellow areas showing time spent with placental infections caused by infection acquired both before and during this point in gestation. In both cases, the chart on the left shows how infections acquired at the different stages change with gestational time in an area with EIR=100 and the chart on the right shows the proportion of the total time spent with placental infection by EIR.

