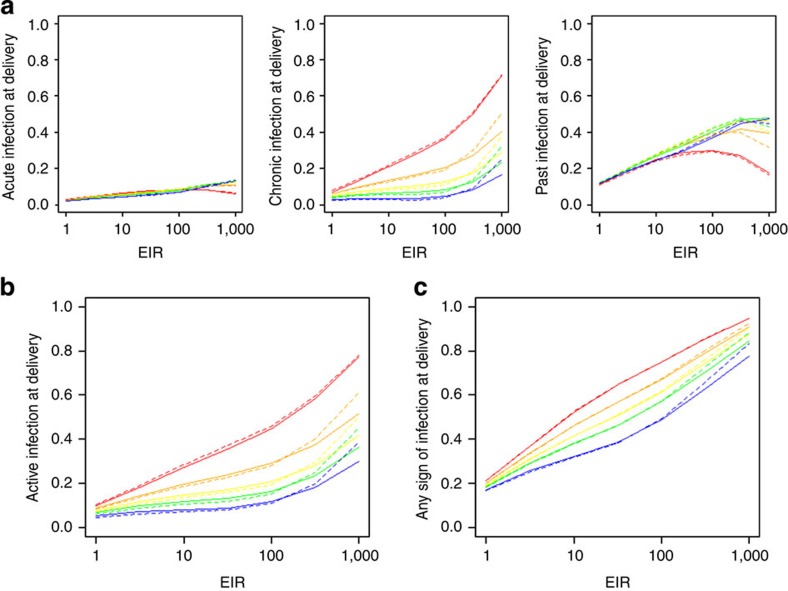
Figure 5. Prevalence of placental sequestration at delivery by EIR.
In each red lines show G1 pregnancies, orange lines G2, yellow lines G3, green lines G4 and blue lines G5+. Solid lines show the infection-dependent immunity and dashed lines show infected-pregnancy-dependent immunity. (a) Shows the posterior mean prevalence of acute, chronic, and past infection. (b) The prevalence of active infection (acute or chronic) at delivery and (c) the prevalence of any sign of infection (acute, chronic or past) at delivery.

