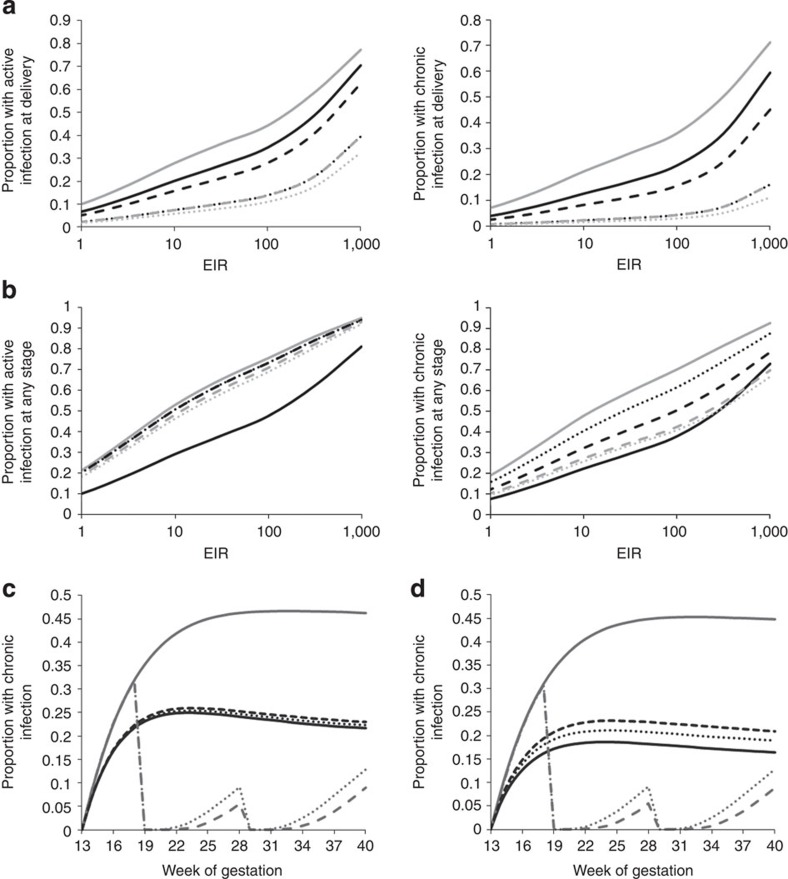
Figure 6. The potential impact of preventative therapy.
(a) Shows both the prevalence of active (acute or chronic) and the prevalence of chronic infection in primigravidae at delivery. (b) Shows the total proportion of primigravidae experiencing placental infection of this type at any stage of their pregnancy. In both (a,b), grey solid lines show estimates in the absence of any intervention, black lines show estimates when a single dose of preventative therapy (resulting in a Gamma-distributed period of prophylaxis P∼Γ(4,5), with a mean of 20 days) is adminstered at 10 (solid lines), 20 (dashed lines) and 30 (dotted lines) weeks gestation, grey dashed lines show estimates when IPT with the same effect is adminstered at 20 and 20 weeks and grey dotted lines show the same two-dose regimen with a mean period of prophylaxis of 30 days following each dose, P∼Γ(5,6). Results shown are posterior mean estimates from the infection-dependent final model. In (c,d), grey lines show the predicted prevalence of chronic infection in primigravidae in the absence of preventative therapy for the Ifakara transmission setting (solid grey lines), the scenario where IPTp is admistered at 18 and 28 weeks and prophylaxis lasts an average of 30 days, P∼Γ(5,6), (dashed lines) and an average of 15 days, P∼Γ(3,5), (dotted lines). Black lines show the prevalence of chronic infection in the same cohorts during their second pregnancy when IPTp is not adminstered. (c) Shows the scenario where immunity is infected-pregnancy-dependent and (d) where immunity is infection-dependent. In all figures ‘chronic infection' refers only to chronic infections, which have moved through an acute stage, rather than chronic infections, which are a mixture of an acute and past infection.

