
Figure 2.
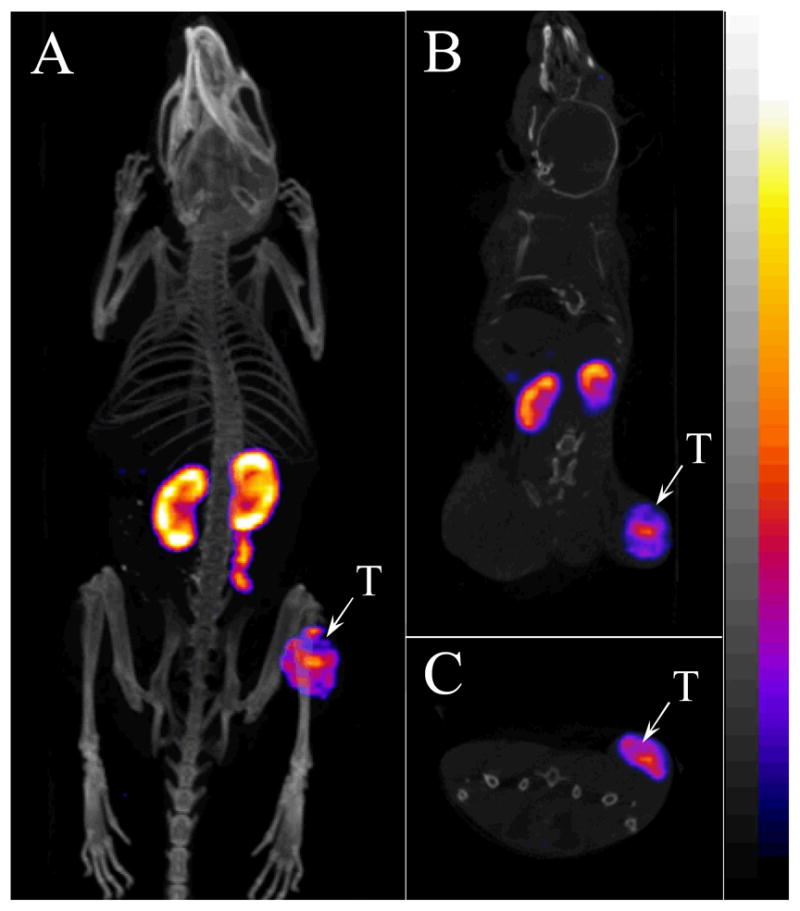
Representative whole-body (A), coronal (B) and transversal (C) SPECT/CT images of 99mTc(EDDA)-HYNIC-GGNle-CycMSHhex in a B16/F1 melanoma-bearing C57 mouse at 2 h post-injection. The tumor lesions (T) were highlighted with arrows on the images.