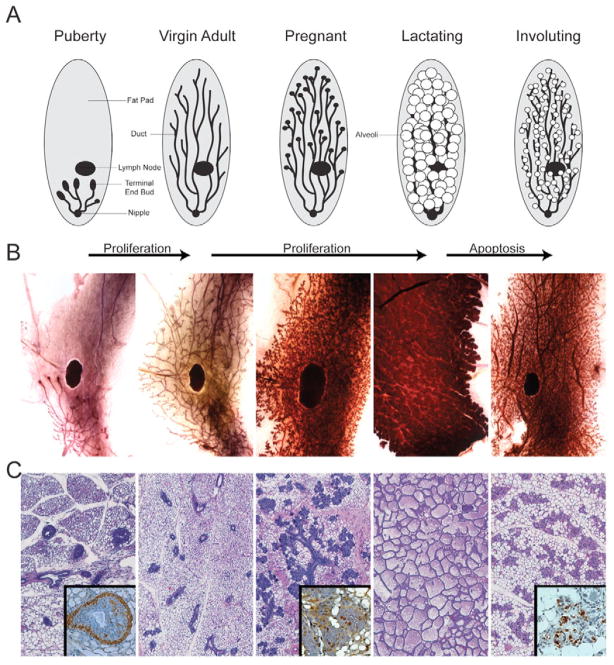
Fig. 1. Mammary gland development.
(A) Schematic illustrating the development of the mouse mammary gland. Each stage of the schematic is accompanied by (B) matched timepoints of mammary glands in wholemount preparations and (C) histological sections. Insets in the histological panels show (from left to right) examples of immunohistochemistry for α smooth muscle actin to highlight the cap cells (puberty), PNCA to illustrate rapid growth (pregnant) and TUNEL to illustrate regulated cell death (involution).

