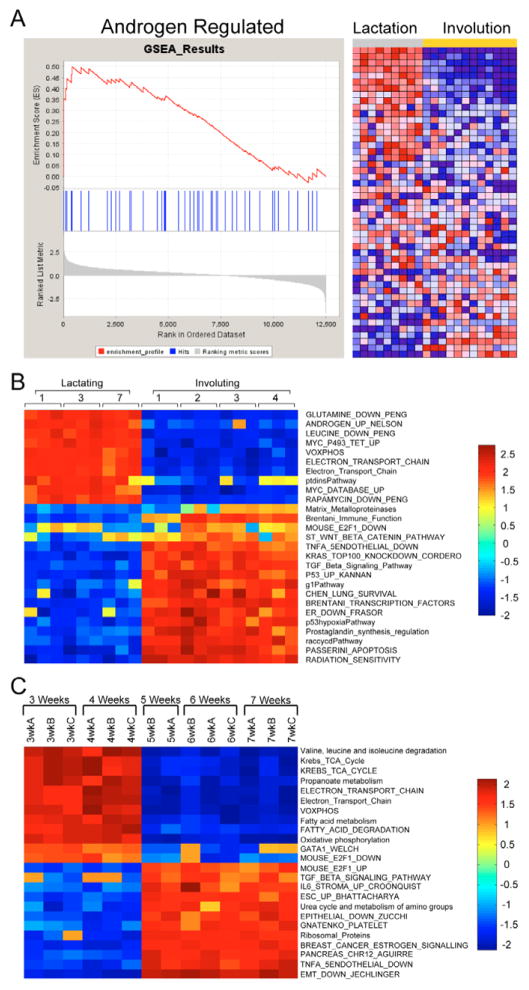
Fig. 4. Gene set enrichment during mouse mammary development.
(A) Lactation (days 1, 3 and 7) and involution (days 1–4) samples were used in GSEA. An example of the enrichment analysis is shown with the random walk for the androgen-regulated gene set as well as the heatmap of the individual genes that compose the gene set. (B) ASSESS, a version of GSEA, was applied to the same data with the normalized enrichment scores being reported on a sample-by-sample basis for each gene set. Results from selected gene sets are shown. (C) In addition, the pubertal dataset was examined, with the two phenotypic classes based on the differential sample clustering from Fig. 2B, and the normalized enrichment scores are shown for a number of gene sets.

