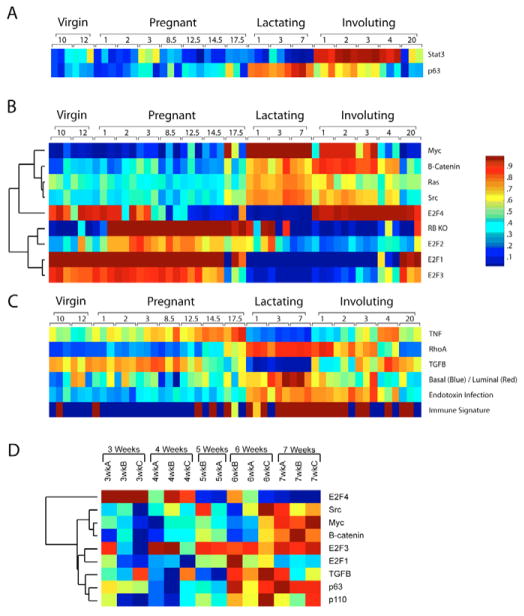
Fig. 5. Pathway activation probabilities.
(A) The probability of pathway activation was examined in the developmental and pubertal datasets. STAT3 and p63, well-established mammary markers, were initially used to validate this method in the mammary development dataset. (B) In addition, a variety of genetic pathways were analyzed for their probability of activation in the developmental dataset, including MYC, β-catenin, RAS, SRC, a knockout signature for Rb, E2F1, E2F2, E2F3 and E2F4. (C) Other phenotypic and genetic pathways were also examined for the probability of their activation including TNF, RHOA, TGFβ, basal/luminal status, endotoxin infection and an immune signature. (D) In addition, the pubertal data were subjected to the same analysis and relevant results are shown.

