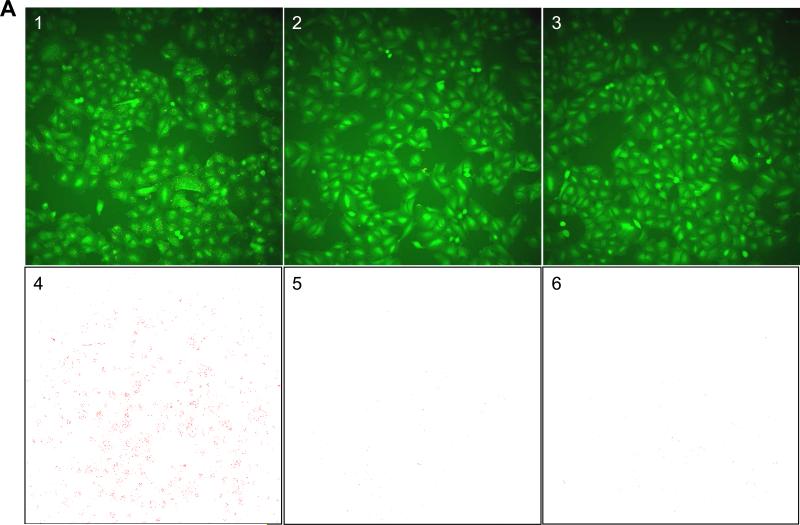
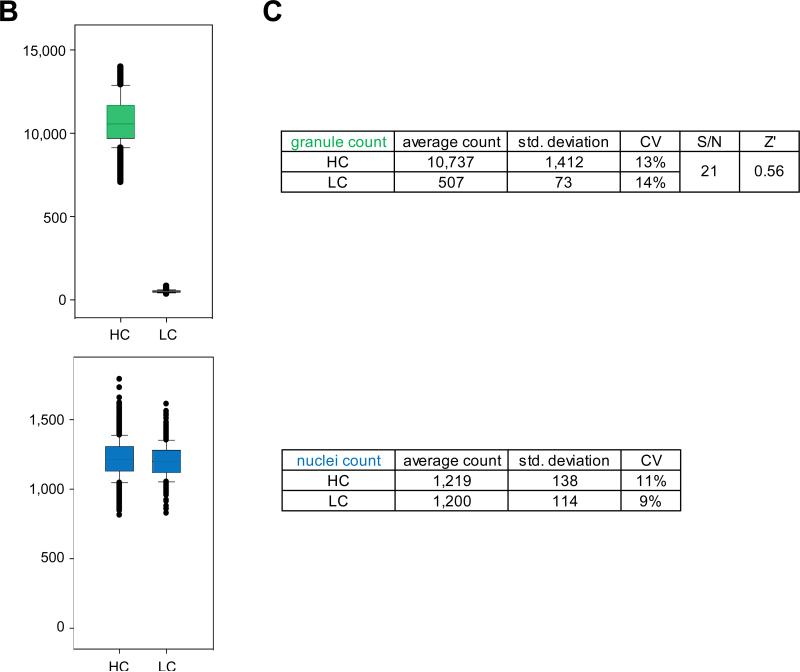
Figure 2. Control well images and control run assessment of the EGFRB assay.
A) INCA2000 images of A549-EGFRB cells in control wells in 384-well microtiter plate format. 1) Granules are observed specifically upon stimulation with 500 nM EGF in control wells containing 1% DMSO (v/v). 2) In control wells containing 10 μM gefitinib in 1%DMSO (v/v), granule formation is prevented even in the presence of 500 nM EGF. 3) Assay well in the absence of EGF stimulation show lack of granule formation. The overlay of automated granule segmentation is represented in red for 4) control wells containing 1% DMSO (v/v), 5) control wells containing 10 μM gefitinib in 1%DMSO (v/v) and 6) assay wells in absence of EGF stimulation. Control wells in the EGFRB assay control run, pilot screen and subsequent dose response studies consist of high control wells (1%DMSO (v/v) final) (1) and low control wells (10 μM gefitinib in 1%DMSO (v/v)) in presence of 500 nM EGF stimulation (2). B) Scatter plot analysis of high control (HC) and low control (LC) wells for the EGFRB assay control run in the granule count and nuclei count readout. C) Summary table of statistics for the EGFRB assay control run. The average granule count and nuclei count, standard deviation, coefficient of variation (CV) for high and low controls, signal to noise ratio (S/N), and calculated Z’ value are presented.


