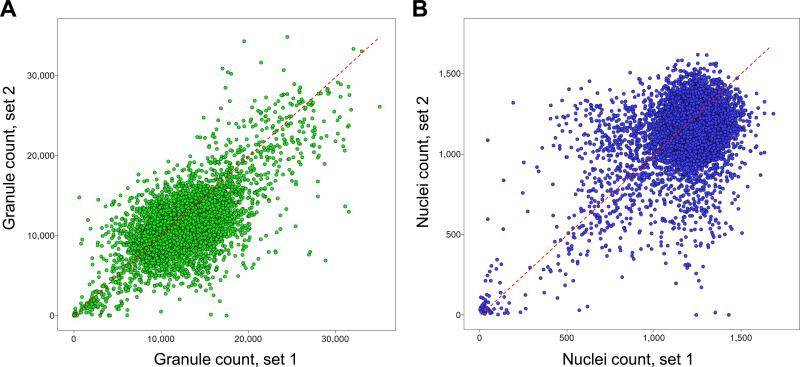
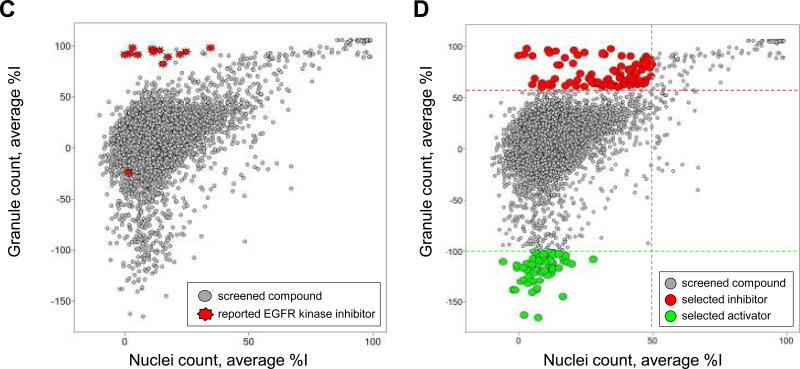
Figure 3. Scatter plot analysis of the pilot screen performed in duplicate.
A library of 6,912 compounds was screened in duplicate to evaluate assay reproducibility and performance. A) The granule count for each compound and for each set of data is plotted as a scatter plot, demonstrating the reproducibility of the granule count readout during the pilot screen. B) The nuclei count for each compound and for each set of data is plotted as a scatter plot, demonstrating the reproducibility of the nuclei count readout during the pilot screen. C) and D) The average percentage inhibition in granule count for each compound for both replicate sets of data is plotted against the average percentage inhibition in nuclei count of each compound for positive selection. C) 12 out of 13 reported EGFR kinase inhibitors are clustered in the scatter plot inducing a high percentage inhibition in granule count and low percentage in nuclei count. D) Positives for inhibition of granule formation in the pilot screen are selected as those compounds inducing greater than 60% inhibition of granule formation and less than 50% inhibition in nuclei count. Activators of granule formation in the pilot screen are selected as those compounds inducing lower than -100% inhibition of granule formation an lower than 50% inhibition in nuclei count.


