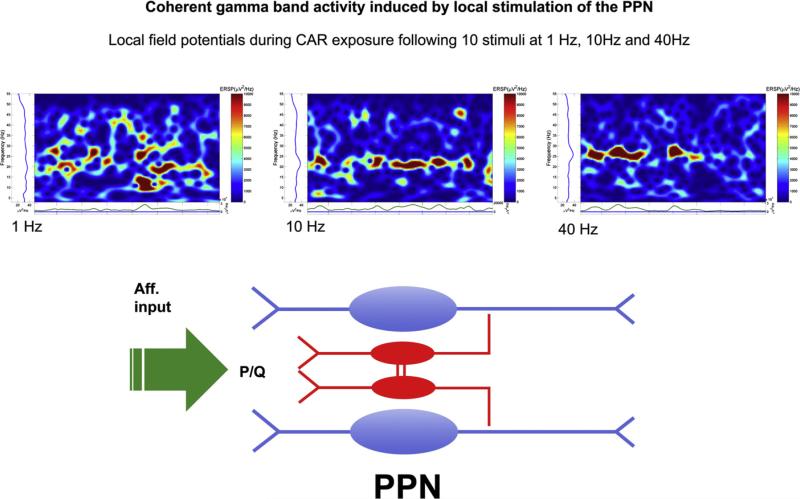
Fig. 3.
Coherent activation of the pedunculopontine nucleus (PPN). Upper panel. Local stimulation of the PPN was applied as 10 pulses at 1 Hz, 10 Hz or 40 Hz, in the presence of carbachol (CAR, 50 μM). The poststimulus event related spectral perturbation (ERSP) of the local field potential recorded in the PPN was calculated. Note that increasing frequency of stimulation induced greater and greater coherence in the response. An ERSP represents a measure of event related brain dynamics induced in the EEG or local field potential spectrum by a stimulus or event. It basically measures average dynamic changes in amplitude of the broad band frequency spectrum as a function of time relative to an experimental event. These analyses use MatLab to generate power spectra for continuous points in time, e.g., during and after stimulation or application of an agent or washout. These graphs plot frequency of activity over time, and the amplitude of the frequency shown is color-coded such that background (control) appears blue, and higher amplitudes appear progressively more yellow, then red. A convenient way of reading these graphs is as a running power spectrum over time.6,7 Lower panel. Hypothesized organization of response to afferent input (green arrow) impinging on PPN dendrites bearing P/Q-type high threshold calcium channels. GABAergic neurons are shown in red and as electrically coupled. Cholinergic and glutamatergic output neurons are shown in blue. Higher frequency stimulation induced coherent peaks of activation that were separated by recurrent gaps. This pattern would be expected following activation of a system which activates output neurons (blue) as well as local inhibitory, electrically coupled neurons (red).

