
Figure 3.
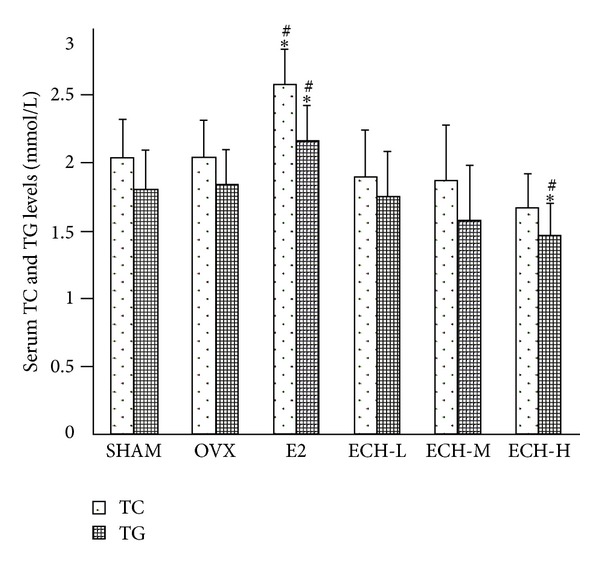
Serum TC and TG levels were determined by assay kit after sacrifice at 12 weeks. Data were expressed as mean ± SD, error bars in the figure are presented as SD, n = 8 specimens/group. # P < 0.05 and ## P < 0.01 versus sham group, *P < 0.05 and **P < 0.01 versus OVX group at the same time point as evaluated by ANOVA.