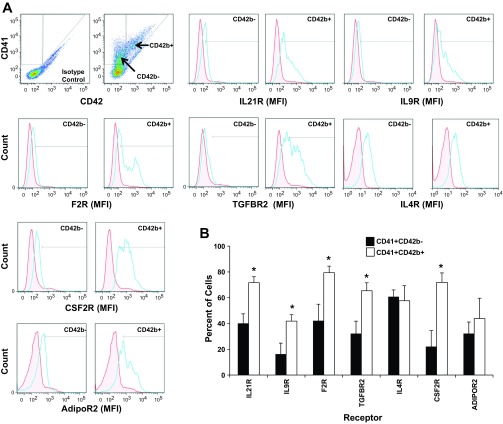
Fig. 2.
Protein expression for each of 7 receptors increases as MKs mature. Culture-derived MKs were isolated and immunostained for CD41, CD42b, and for each of the indicated receptors. A: dot plot analysis of CD42 and CD41 expression on culture-derived MKs was used to define gates for the subpopulations, CD41+/CD42b+ and CD41+/CD42b−. Representative single-parameter histogram profiles for gated CD41+CD42b− cells or CD41+CD42b+ cells were generated depicting the mean fluorescent intensity (MFI) for each receptor relative to an isotype control (red, isotype control; blue, receptor). B: the percent of CD41+ CD42b− cells and CD41+CD42b+ cells that express the indicated receptor as measured by flow cytometry. Values are means ± SE and are representative of 3 independent experiments and from 3 biological samples. *P < 0.05.

