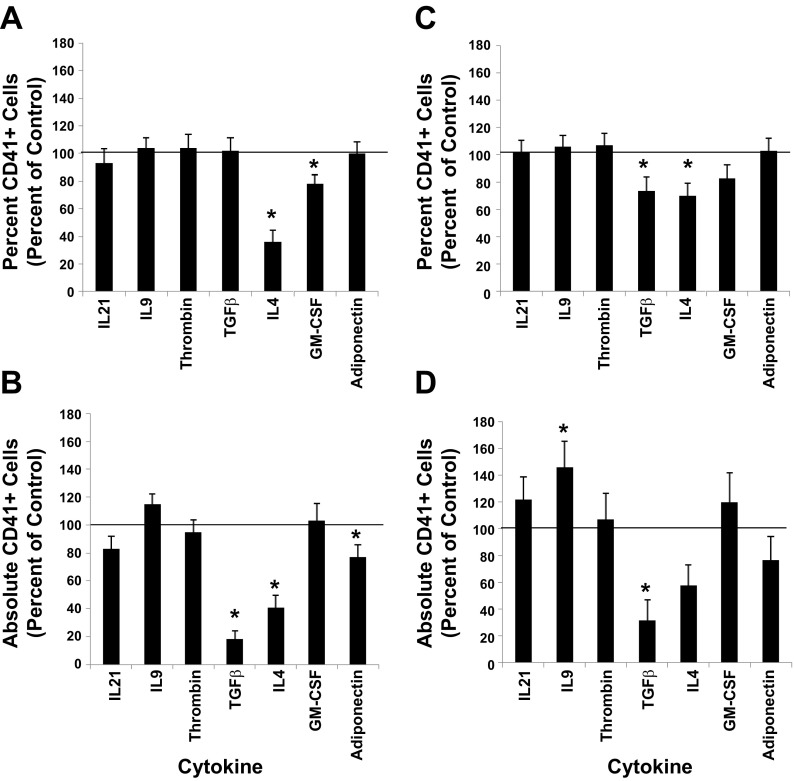
Fig. 4.
Differentiation responses. A, B: UCB CD34+ cell cultures were initiated with IL3, IL6, SCF, TPO (36ST) (i.e., control) along with one of the indicated cytokines. After 10 days of culture, the percent of CD41+ cells in culture. C, D: UCB CD34+ cell cultures were initiated with 36ST. After 7 days in culture, one of the indicated cytokines was added. A–D: at day 10 of culture, the percent of CD41+ cells in each culture was measured by flow cytometry. The percent and absolute number of cells expressing CD41+ are normalized to the control group. The line at the 100% level in each graph represents the response of control cultures. Data are shown as means ± SE in triplicate culture and are representative of 3 independent experiments and from 3 biological samples. *P < 0.05.

