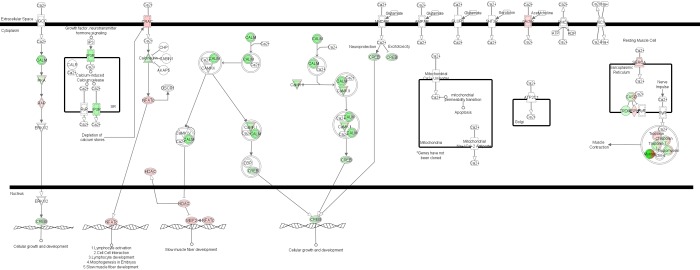
Fig. 2.
Differential expression of genes associated with calcium signaling. Prominent genes of the Ingenuity Pathway Analysis network “calcium signaling” are shown relative to their cellular location. The expression of genes colored red was significantly greater in HRmini, whereas the expression of genes colored green was greater in HRnormal (P < 0.05, after correction for multiple testing).

