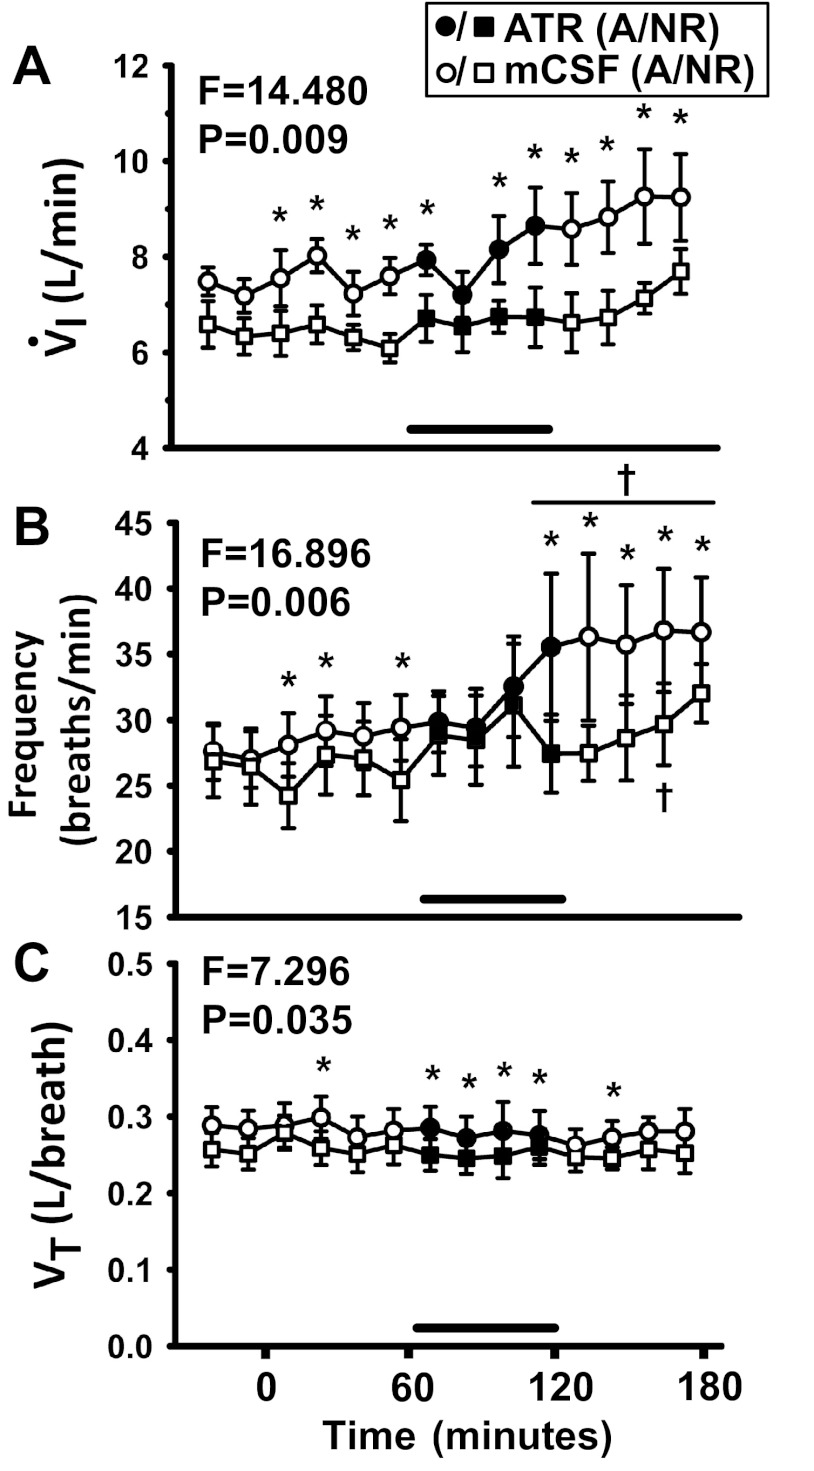
Fig. 3.
There was a significant (P < 0.05) difference in breathing and the effect of atropine dialysis at night on V̇I (A), f (B), and VT (C) in the awake state compared with NREM (n = 7, 2-way RM ANOVA, time and sleep state as factors). x-Axis is time from start of dialysis (min); symbols left of 0 min indicate predialysis period. Squares represent breathing during NREM sleep (NR); circles represent breathing during the awake state at night (“A” in legend). Open symbols indicate dialysis of mCSF; filled symbols and horizontal bar indicate dialysis of atropine. F and P values are taken from 2-way RM ANOVA. *P < 0.05 between states and †P < 0.05 compared with one or more points in the predialysis control period or hour 1, as determined by post hoc analysis (Holm-Sidak). Power of 2-way RM ANOVA tests comparing awake and non-rapid-eye-movement (NREM) sleep were 0.87, 0.92, and 0.56 for V̇I, f, and VT, respectively.

