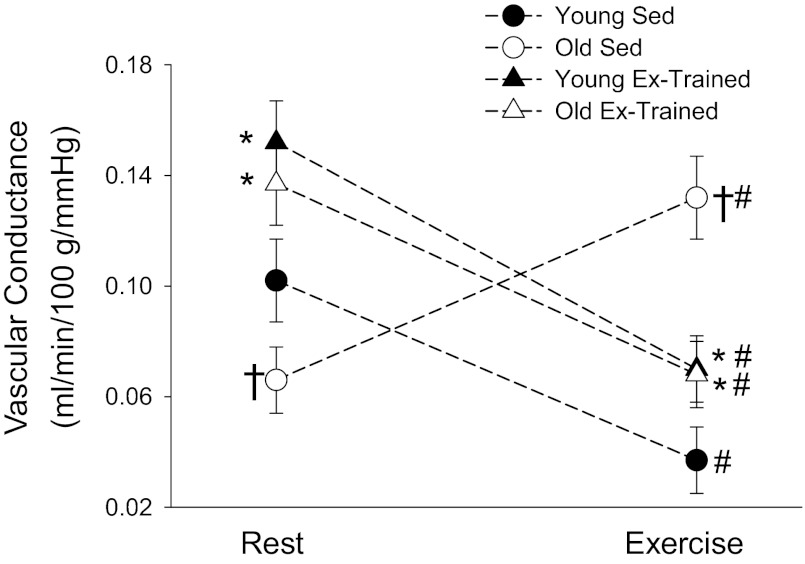
Fig. 3.
Magnitude and directional change of vascular conductance during the transition from rest to the steady state of exercise in intra-abdominal AT of young (n = 13) and old (n = 7) Sed and young (n = 8) and old (n = 5) exercise (Ex)-trained rats. Values are mean ± SE. *P < 0.05 vs. Sed of corresponding age group; †P < 0.05 vs. young group same condition; #P < 0.05 vs. resting value.

