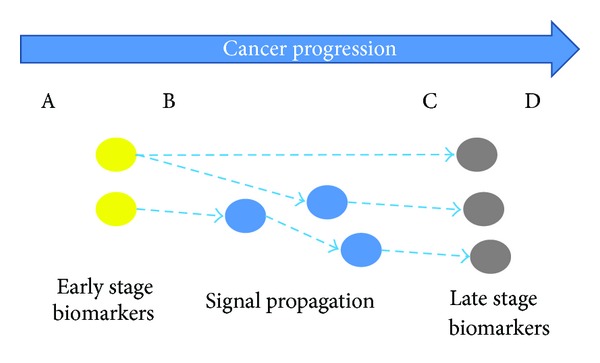
Figure 1.

The diagram of signal propagation analysis during cancer progression. The blue arrow represents cancer progression. The colorectal cancer has four stages: Dukes A, B, C, and D. From A to D, the cancer gets worse and worse. Yellow nodes and grey nodes represent the biomarkers in the early and late stage, respectively. The goal of signal propagation analysis is to understand the transition from early stage biomarkers to late stage biomarkers by analyzing the signal propagation in the protein interaction network.
