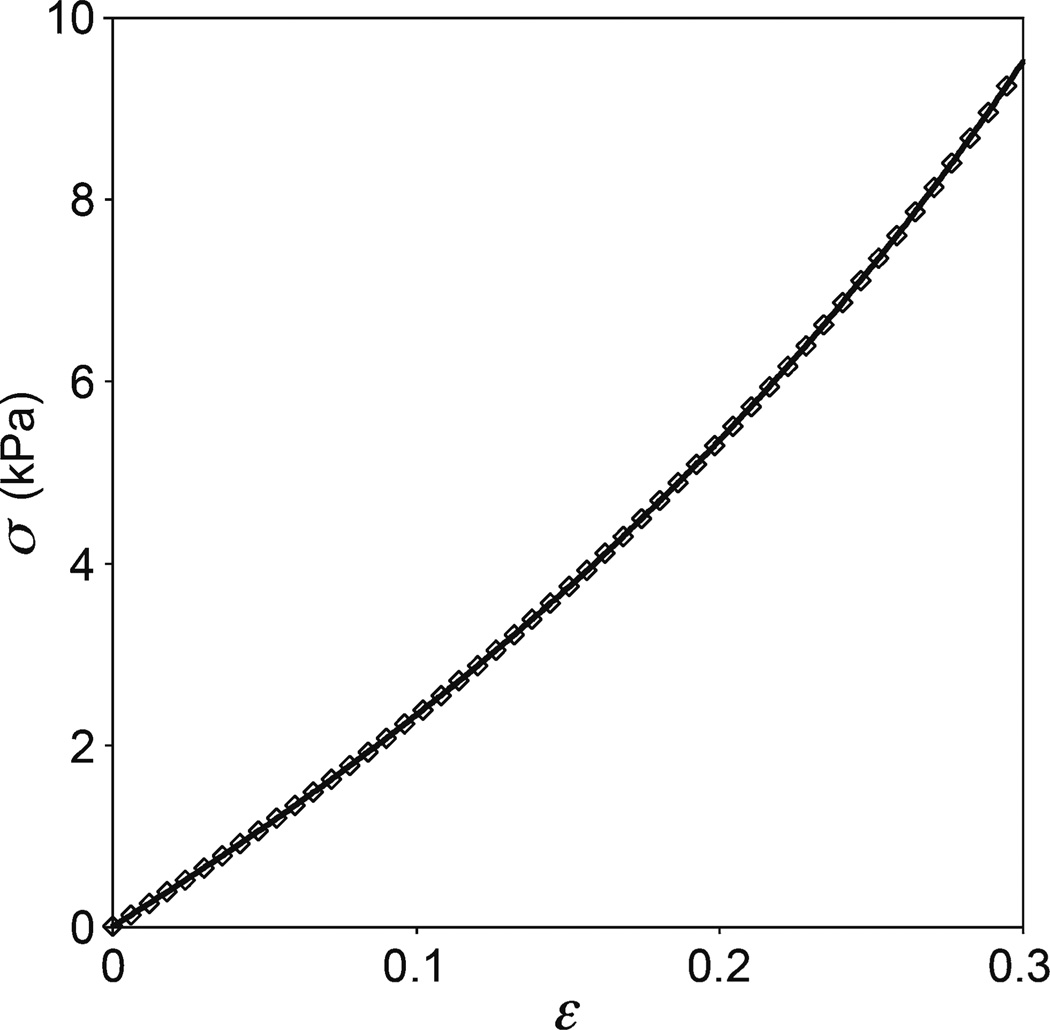
Fig. 3.
Sample compressive engineering stress–strain behavior of a PVA gel cylinder. Every tenth data point is plotted. Compressive stresses and strains are taken to be positive for consistency with the convention used in indentation. The solid curve is the best fit (r2 = 0.9999) to the data using the uniaxial Mooney-Rivlin equation (see Table 1). The analysis was limited to the deformation range 0 < ε < 0.3. For this particular case, E0 = 20.69 kPa and the fitting parameters are C1 = 3.214 kPa and C2 = 0.235 kPa. The quality of fit is virtually indistinguishable among the various hyperelastic models

