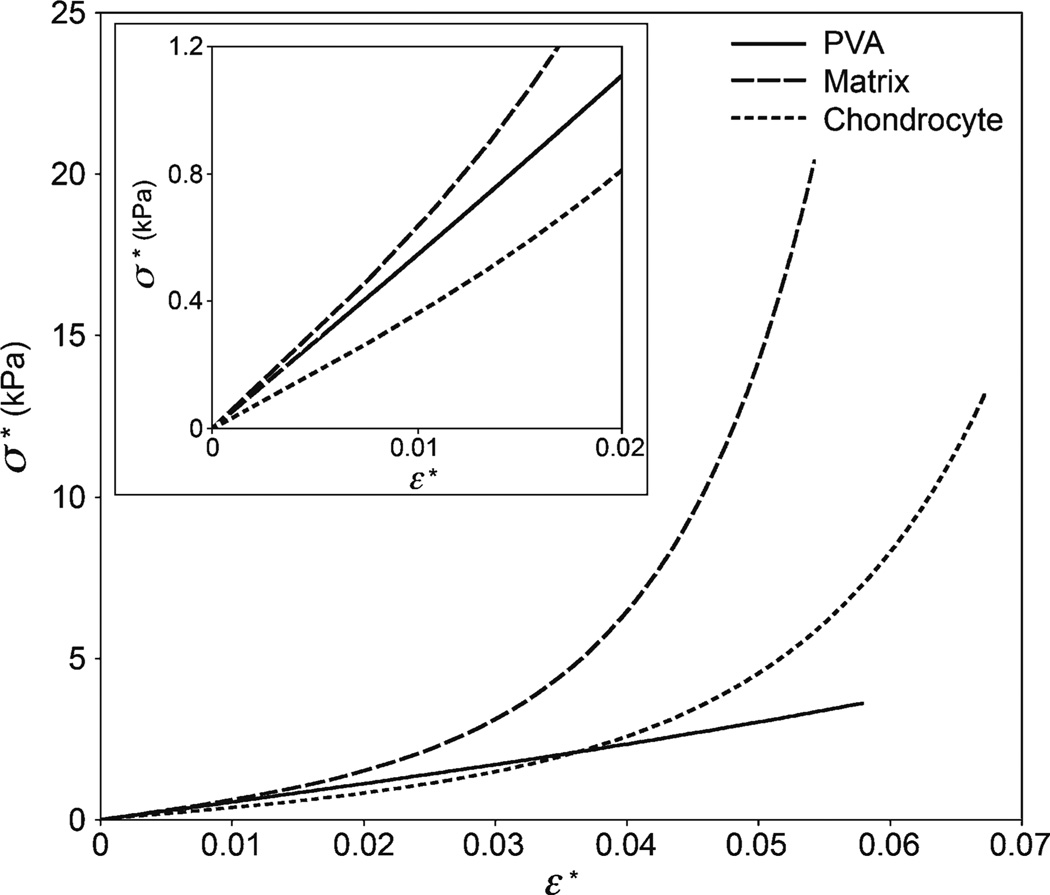
Fig. 7.
Indentation stress versus strain (0.2 a/R) for representative microindentations of the PVA gel, mouse cartilage extracellular matrix, and chondrocytes. Data are from the Fung fit of sample AFM datasets (PVA E0 = 19.1 kPa, matrix E0 = 20.7 kPa, chondrocyte E0 = 12.2 kPa). The stress–strain response of the PVA gel appears linear (due to the scaling, nonlinearity is not obvious) while the cartilage components are highly nonlinear. Inset shows the relationship up to 2% strain

