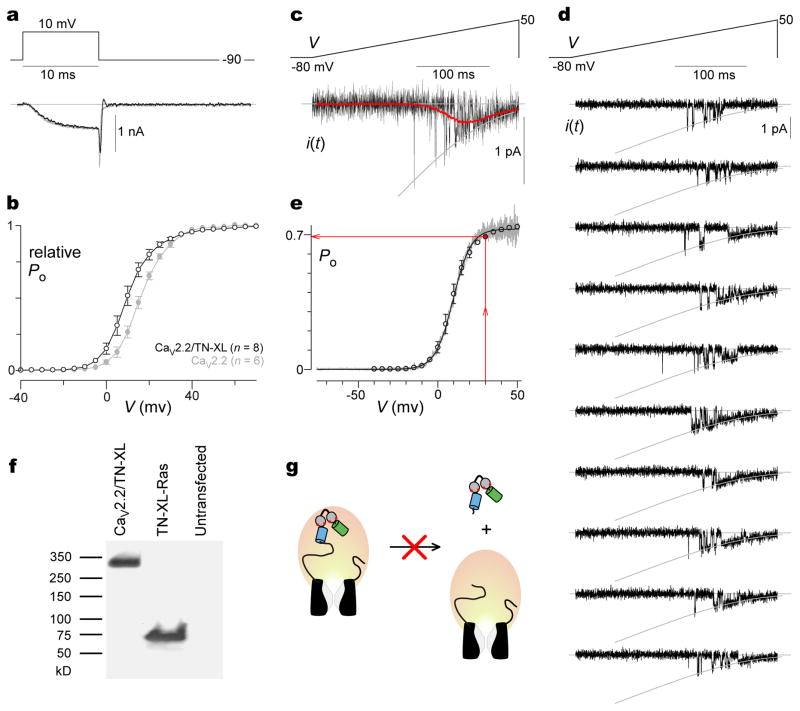
Figure 3. CaV2.2/TN-XL fusion construct preserves function of channel.
a, Exemplar whole-cell currents of HEK293 cells expressing CaV2.2 channels (gray) or CaV2.2/TN-XL channels (black), using 10 mM Ca2+ as charge carrier, and 10 mM EGTA intracellular Ca2+ buffering. b, Whole-cell tail-activation curves of CaV2.2 (gray) and CaV2.2/TN-XL (black), obtained from records as in a. Data shown as as mean ± sem with number of cells in parentheses. c, Single-channel analysis of CaV2.2/TN-XL. Top, On-cell ramp-voltage waveform delivered every 5–15 s. Bottom, Exemplar single-channel sweep shown at high-gain magnification (100–200/patch). 90 mM Ba2+ as charge carrier; 2 kHz lowpass filtering. Leak-subtracted traces were averaged, yielding red I–V curve. Unitary current relation (convex gray curve) was fitted to the open-channel current level using GHK equation10. d, Multiple exemplar single-channel sweeps from another patch, shown at lower-gain magnification to impart a sense of the overall reproducibility and excellent resolution of elementary events. Format as in c. e, Single-channel PO–V relation (gray, with fit in black, average of n = 4 patches), determined by dividing I–V curve (c, red trace) by unitary current relation (c, gray GHK fit). PO–V curve was calibrated in voltage by aligning the single-channel activation curve with the whole-cell curve reproduced from b (open circles). From calibrated PO–V curve, the Po at 30 mV is 0.69. f, Immunoblots of HEK293 cell lysates probed with anti-GFP antibody; (left) CaV2.2/TN-XL at ~320 kD; (middle) TN-XL-Ras at ~71 kD; (right) control (untransfected) cells for reference. g, Lack of lower molecular-weight species in leftmost lane of panel f excludes proteolysis of sensor from channel.

