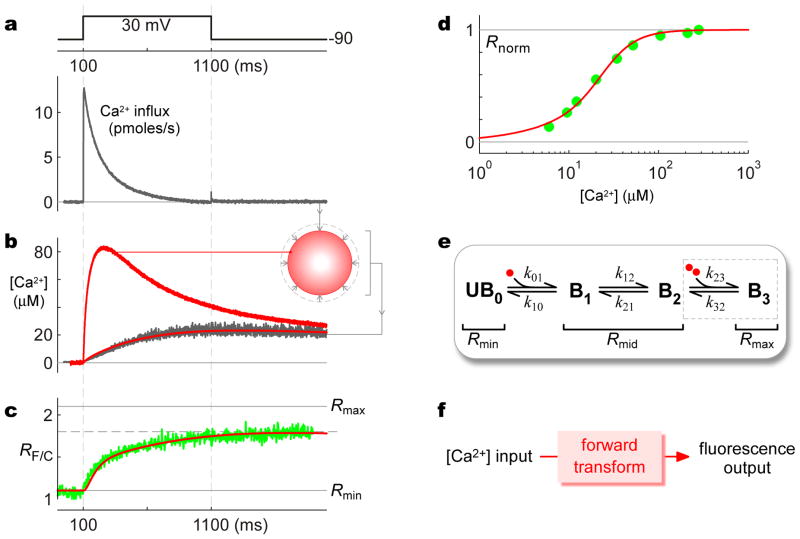
Figure 4. Calibration of CaV2.2/TN-XL fusion construct.
a, High-amplitude Ca2+ influx into HEK293 cell expressing CaV2.2 channels, observed with 10 mM external Ca2+ and minimal internal Ca2+ buffering of 1 mM EGTA. b, Simultaneous [Ca2+] measurement (dark trace) deduced from 10 μM Fluo-4FF Ca2+-indicator fluorescence from entirety of same cell (514 nm excitation, 545 nm emission). Ca2+ determination rendered ratiometric by inclusion of 2.5 μM red Alexa 568 dye (514 nm excitation, 580 nm long-pass emission). Inset, cartoon of spatial Ca2+ gradients in this cell. Red traces, projected [Ca2+] waveforms from Ca2+ diffusion mechanism constrained by Ca2+ input in a and aggregate [Ca2+] (dark trace): lower red trace, aggregate [Ca2+]; upper red trace, submembranous [Ca2+]. c, Average FRET-ratio (RF/C) response of CaV2.2/TN-XL channels in TIRF volume (green trace); same protocol as in a and b. Red trace, output of TN-XL forward transform in e, when driven by submembranous [Ca2+] input (b, upper red trace). d, Normalized steady-state FRET-ratio response (Rnorm = (RF/C − Rmin)/(Rmax − Rmin) of CaV2.2/TN-XL to [Ca2+] (experimental green symbols). Red trace, steady-state output of TN-XL forward transform in e, when driven by differing fixed [Ca2+]. e, State-diagram representation of CaV2.2/TN-XL. Red circles, Ca2+ ions. f, System of states and corresponding fluorescence/FRET properties constitutes a forward transform that predicts TN-XL sensor outputs as a function of time-varying Ca2+ inputs.

