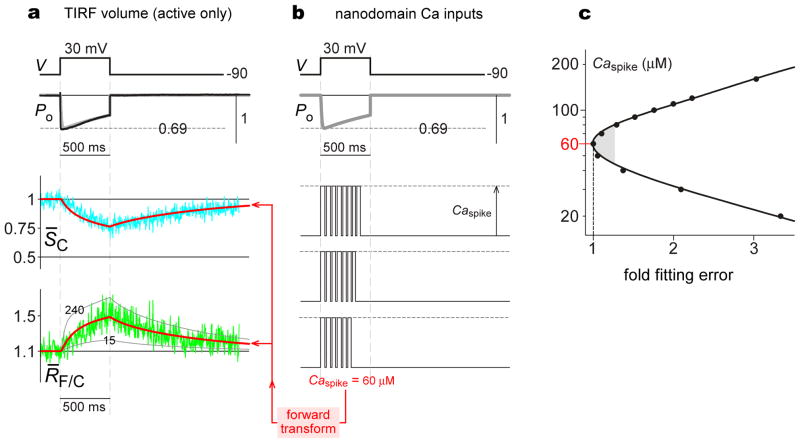
Figure 6. Estimates of nanodomain Ca2+ amplitude from CaV2.2/TN-XL responses.
a, Average CaV2.2/TN-XL responses to nanodomain Ca2+ signals, corrected to reflect signal of active channels alone. Top, black trace plots average whole-current, rescaled to open probability PO by normalizing peak current during 30-mV pulse to 0.69. Gray trace, exponential fit to PO waveform. Middle, cyan trace plots average S̄C, corrected CFP signal. Red trace, forward transform prediction of experimental S̄C using Caspike = 60 μM. Bottom, Green trace plots average R̄F/C, corrected FRET-ratio signal. Red trace, forward transform prediction of experimental R̄F/C using Caspike = 60 μM. Gray traces, transform prediction with Caspike as labeled. b, Nanodomain Ca2+ signals input to forward transform for prediction of CaV2.2/TN-XL responses in a. Top, PO waveform reproduced from a. Middle, Schematic of stochastic Ca2+ pulses in nanodomain. Bottom, Forward transform box with parameters in Table 1. c, Caspike estimation criteria. Presumed Caspike values plotted versus fold-fitting error (sum of squared deviations between fit and data, normalized to sum with Caspike = 60 μM). Cusp of plot denotes Caspike = 60 μM as best fit. Shaded zone specifies approximate confidence region, where fits yield errors within 25% of minimum.

