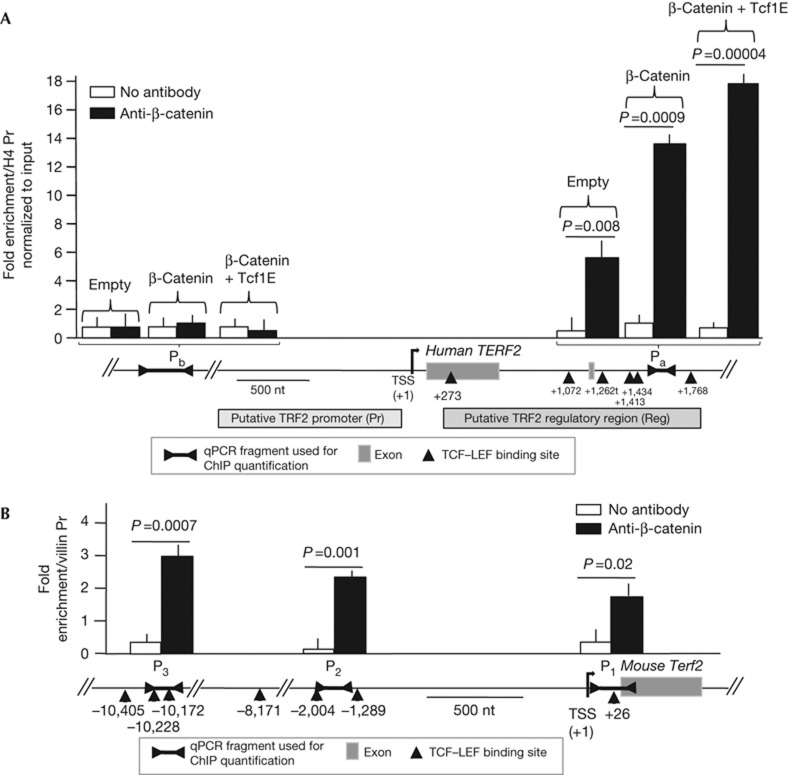
Figure 2.
β-Catenin binds to TERF2 regulatory regions containing TCF–LEF sites (marked as triangles). The coordinates of the centres of the DNA sequences of these sites are given relative to the transcription start site (+1). Each quantitative PCR (qPCR) value represents the average of at least three independent chromatin immunoprecipitation (ChIP) experiments. P-value was determined using Mann–Whitney test. (A) Genomic map of the human TERF2 gene and quantification by qPCR of the enrichment of the Pa and Pb DNA fragments relative to a sequence of the histone H4 promoter (H4 Pr). Empty, β-catenin and Tcf1E indicate that the HCT116 cells were transfected with an empty plasmid or with a plasmid expressing a mutated form of β-catenin or with a plasmid expressing Tcf1E. (B) Genomic map of the mouse TERF2 gene and quantification of the enrichment of the P1, P2 and P3 DNA fragments relative to a sequence of the Villin promoter in immunoprecipitates from ChIP experiments of normal intestinal tissues from APC1638N/+ mice using a β-catenin antibody. For both panels, error bar represents the mean±s.e.m. for four independent experiments.

