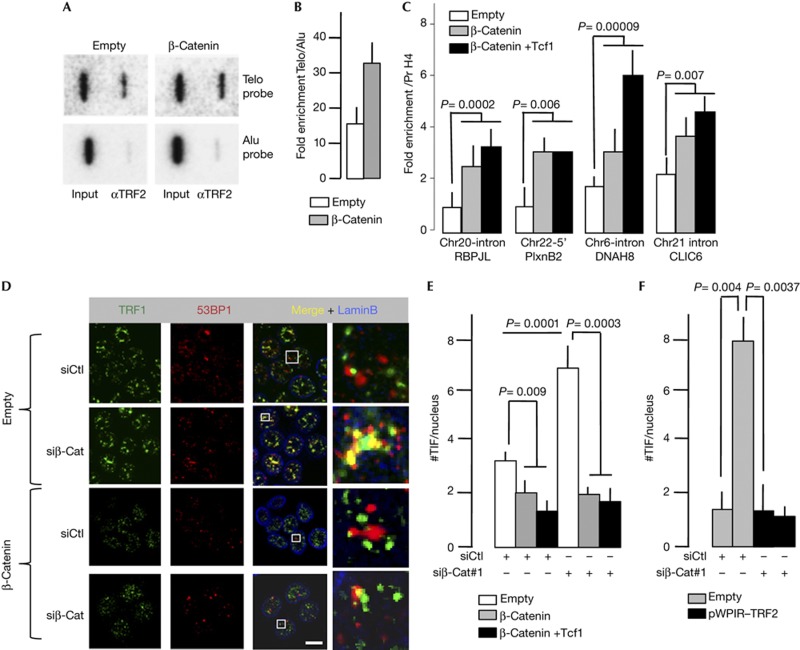
Figure 5.
Telomere changes caused by modulation in β-catenin levels. Images (A) and quantification (B) of chromatin immunoprecipitation (ChIP) analysis of HCT116 cells overexpressing β-catenin and Tcf1E (n=3), performed using TRF2 antibodies and revealed by slot blotting with a telomeric DNA probe. Error bar represents the mean±s.e.m. (C) The ChIP-immunoprecipitated DNA from A and B was subjected to PCR with primers specific for different interstitial telomeric sequences (ITSs). The name of the ITS-proximal gene is shown. P-value was determined using Mann–Whitney test. Error bar represents the mean±s.e.m. for six independent experiments. (D) Representative images from immunofluorescence experiments used to analyse TIF. (E) Number of TIF in HCT116 cells on Ctnnb1 knockdown. At least 40 nuclei per condition were analysed. P-value was determined using Student’s t-test. (F) Number of TIF in HCT116 cells combining Ctnnb1 knockdown and TRF2 overexpression. At least 40 nuclei per condition were analysed. P-value was determined using Student’s t-test. For panels E and F, error bar represents the mean±s.e.m. for three independent experiments. H4 Pr, histone H4 promoter.

