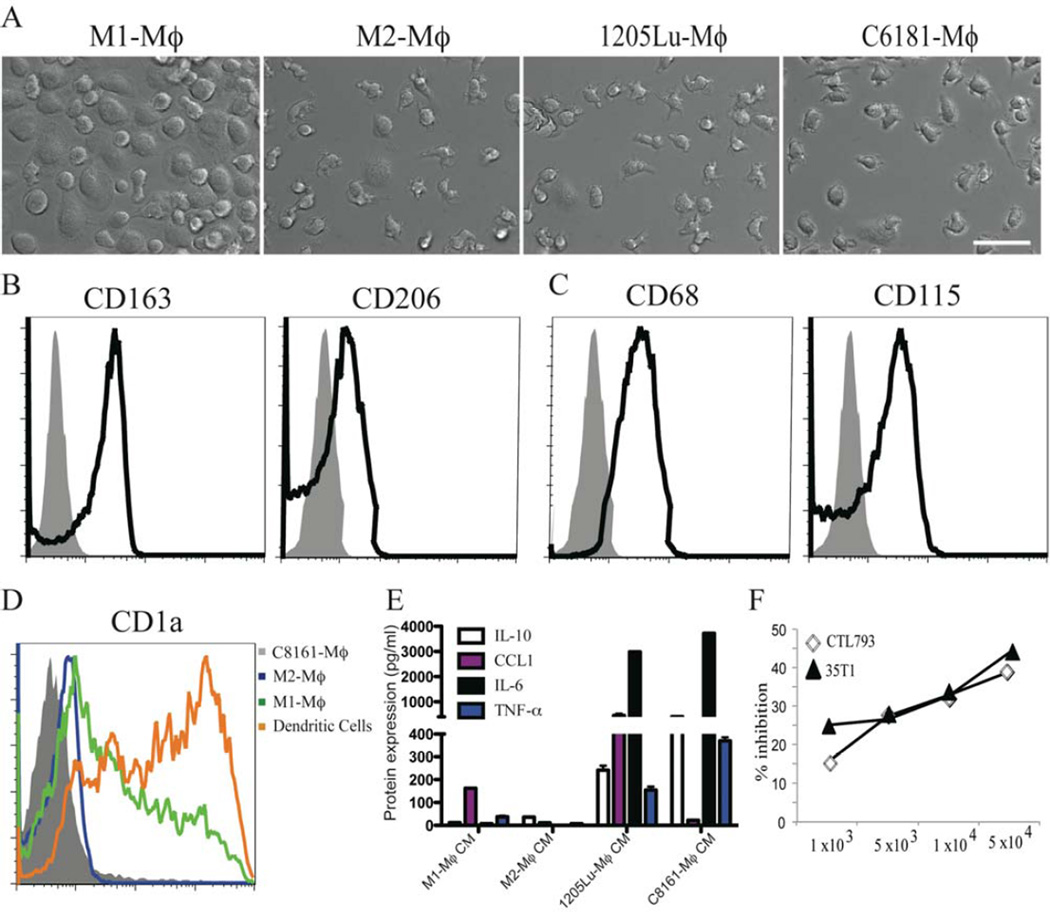
Figure 1. Differentiation of monocytes to MCMI-Mϕ.
Monocytes from healthy donors were cultured in the presence of GM-CSF (10 ng/ml), M-CSF (10 ng/ml), 1205Lu-MCM or C8161-MCM for 7 days. (A) Morphological analysis of M1-Mϕ, M2-Mϕ, 1205Lu-Mϕ and C8161-Mϕ using a Nikon inverted microscope. Scale bar = 50 µm. (B) & (C) Expression of M2-Mϕ and macrophage surface markers in C8161-Mϕ. FACS analysis was performed for cell surface expression of the M2-Mϕ markers (CD163, CD206) in C8161-Mϕ (B), macrophage markers (CD68 and CD115) (C). Gray shadow fills = isotype matched control; black lines = primary antibodies. (D) FACS analysis of CD1a expression in M2-Mϕ, M1-Mϕ, DCs and C8161-Mϕ. Each experiment is representative of at least 6 independent experiments from 6 different healthy donors. (E) Conditioned medium from M1-Mϕ, M2-Mϕ, 1205Lu-Mϕ and C8161-Mϕ were harvested. Production of M2-Mϕ cytokine and chemokines IL-10, CCL2, and M1-Mϕ cytokines IL-6 and TNFα were measured by Luminex analysis. (F) MCMI-Mϕ inhibit the proliferation of anti-CD3-induced proliferation of human anti-melanoma specific T cells. Anti-melanoma specific T cell clones were co-cultured with increased numbers of 1205Lu-Mϕ in the presence of anti-CD3 (1 µg/m) for seven days, 3H-TdR was added 16 h before the cells were harvested.

