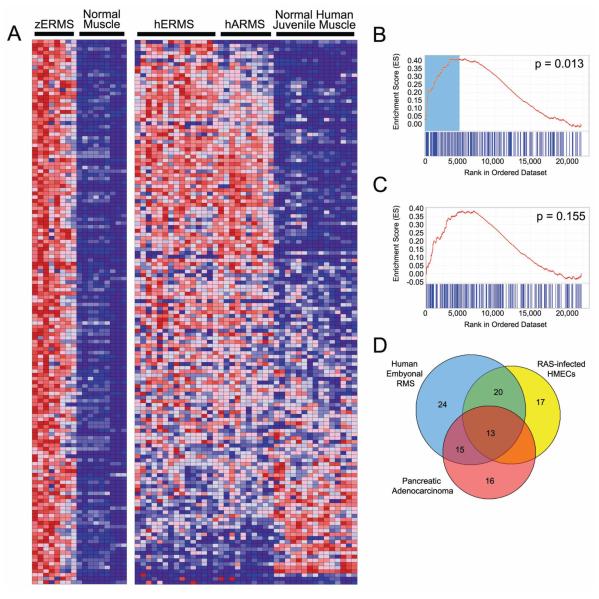
Figure 5.
Gene Set Enrichment Analysis (GSEA) identifies a conserved gene signature in both zebrafish and human ERMS. A) Heat map showing genes up-regulated in zebrafish ERMS when compared with normal muscle at 2.25-fold change (left) and juxtaposed to the corresponding human orthodox in ERMS, ARMS and normal juvenile muscle (right). Graphical representation of the rank-ordered gene lists found when comparing human ERMS (B) or translocation+ ARMS (C) to normal muscle. The up-regulated gene set identified in zebrafish ERMS is significantly enriched in human ERMS (B, p=0.013). (D) A Venn diagram illustrating the genes from the up-regulated zebrafish ERMS gene set that contribute maximally to the GSEA score in the pancreatic adenocarcinoma, human ERMS and RAS-infected human mammary epithelial cells (HMECs). Genes found in the non-overlapping blue portion are ERMS-specific and comprise the MYF5 transcription factor. By contrast, the other genes are likely RAS-targets and are found to be coordinately regulated in zebrafish RAS-induced ERMS and either RAS-infected human mammary epithelial cells or human pancreatic Aden carcinoma, of which >90% have activating mutations in kRAS.

