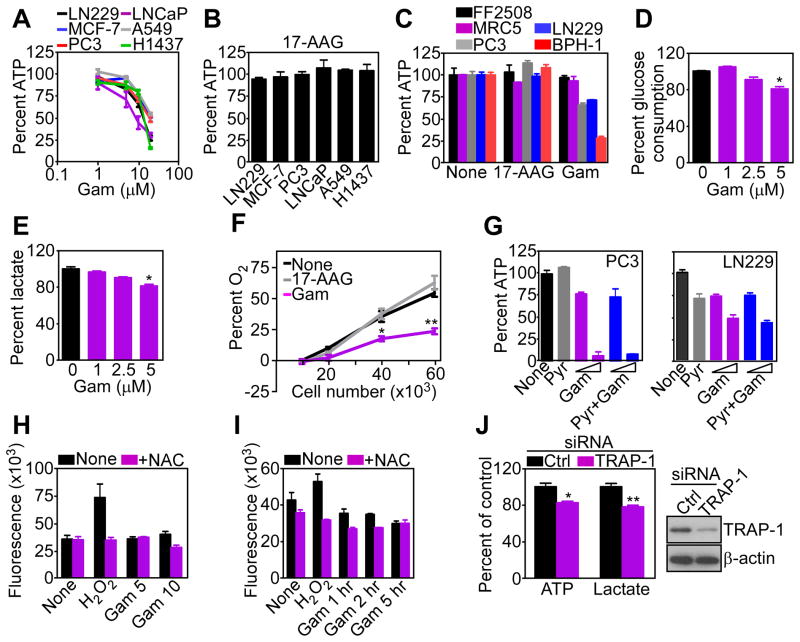
Figure 1. Mitochondrial HSP90 regulation of tumor bioenergetics.
(A) Breast (MCF-7), prostate (PC3, LNCaP), lung (A549, H1473) or brain (glioblastoma, LN229) tumor cell lines were treated with the indicated concentrations of Gamitrinib (Gam) for 5 hr and analyzed for ATP production. Mean±SEM (n=3).
(B) The indicated tumor cell lines were treated with 17-AAG (20 μM) for 5 hr and analyzed for ATP production. Mean±SEM (n=3).
(C) The indicated normal (FF2508, MRC5) or tumor (LN229, PC3, BPH-1) cell lines were incubated with 17-AAG or Gamitrinib (10 μM) for 5 hr and analyzed for ATP production. Mean±SEM (n=3).
(D, E) LN229 cells were treated with the indicated concentrations of Gamitrinib for 5 hr and analyzed for glucose consumption (D) or extracellular lactate content (E). Mean±SEM (n=3); *, p=0.015–0.022.
(F) LN229 cells were plated at the indicated number, treated with vehicle, Gamitrinib or 17-AAG (5 μM) and analyzed for O2 consumption by a fluorimetric assay. Mean±SEM (n=3), *, p=0.019; **, p=0.001.
(G) PC3 or LN229 cells were incubated with sodium pyruvate (Pyr, 1 mM) in the presence (5, 10 μM) or absence (None) of Gamitrinib for 7 hr and analyzed for ATP production. Mean±SD of replicates (n=2).
(H) LN229 cells were labeled with the fluorescent dye H2-DCFA (6 μM), treated with Gamitrinib (5–10 μM), and analyzed for changes in fluorescence expression in a luminometer, with or without the antioxidant N-acetyl-L-cysteine (10 mM, NAC). H2O2 (5 mM) was used as control. Mean±SEM (n=4).
(I) H2-DCFA-labeled LN229 cells were treated with 10 μM Gamitrinib for the indicated time intervals and analyzed for changes in ROS production at the indicated time intervals with or without NAC. H2O2 was a control. Mean±SEM (n=3).
(J) LN229 transfected with control (Ctrl) or TRAP-1-directed siRNA were analyzed for changes in ATP production or extracellular lactate content (left) or TRAP-1 protein level (right). Mean±SEM (n=3); *, p=0.017; **, p=0.005. See also Figure S1.

