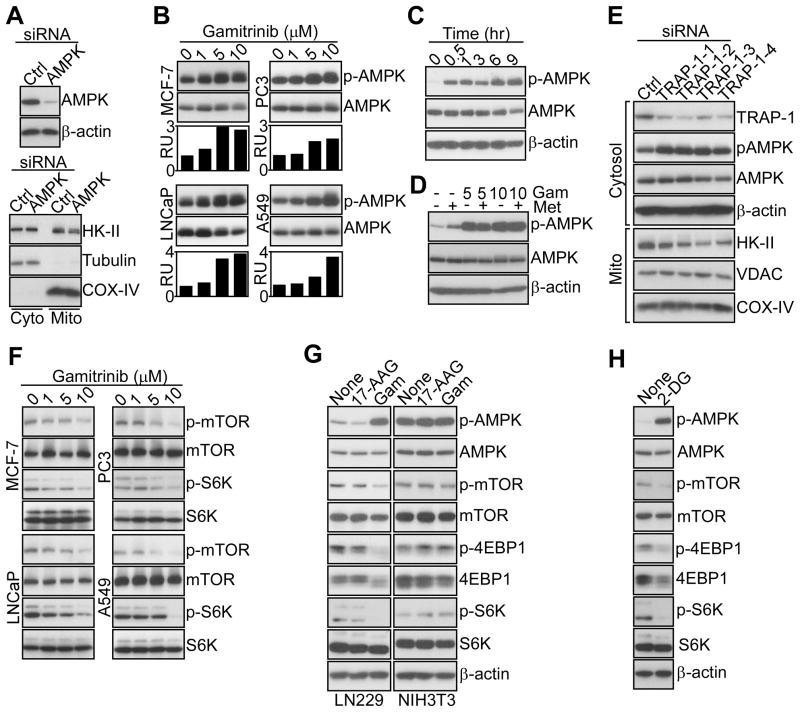
Figure 3. Modulation of AMPK and mTORC1 signaling by mitochondrial HSP90s.
(A) LN229 cells were transfected with control (Ctrl) or AMPK-directed siRNA, and total cell extracts (top) or isolated cytosol (Cyto) or mitochondrial (Mito) fractions (bottom) were analyzed by Western blotting.
(B) The various tumor cell lines were treated with the indicated concentrations of Gamitrinib, and analyzed by Western blotting after 5 hr. Bar graphs, densitometric quantification of protein bands. RU, relative units.
(C) Gamitrinib-treated (10 μM) LN229 cells were analyzed at the indicated time intervals by Western blotting.
(D) LN229 cells were treated with metformin (Met, 5 mM) in the presence or absence Gamitrinib (Gam, 5–10 μM), and analyzed after 12 hr by Western blotting.
(E) LN229 cells were transfected with control (Ctrl) or the indicated individual siRNA sequences against TRAP-1 and isolated cytosol or mitochondrial (Mito) fractions were analyzed by Western blotting.
(F) The indicated tumor cell types were treated with increasing concentrations of Gamitrinib and analyzed after 12 hr by Western blotting.
(G) Tumor (LN229) or normal (NIH3T3) cell types were treated with Gamitrinib or 17-AAG (10 μM), and analyzed after 12 hr by Western blotting.
(H) LN229 cells were treated with 2-DG (25 mM) and analyzed after 12 hr by Western blotting. See also Figure S2.

