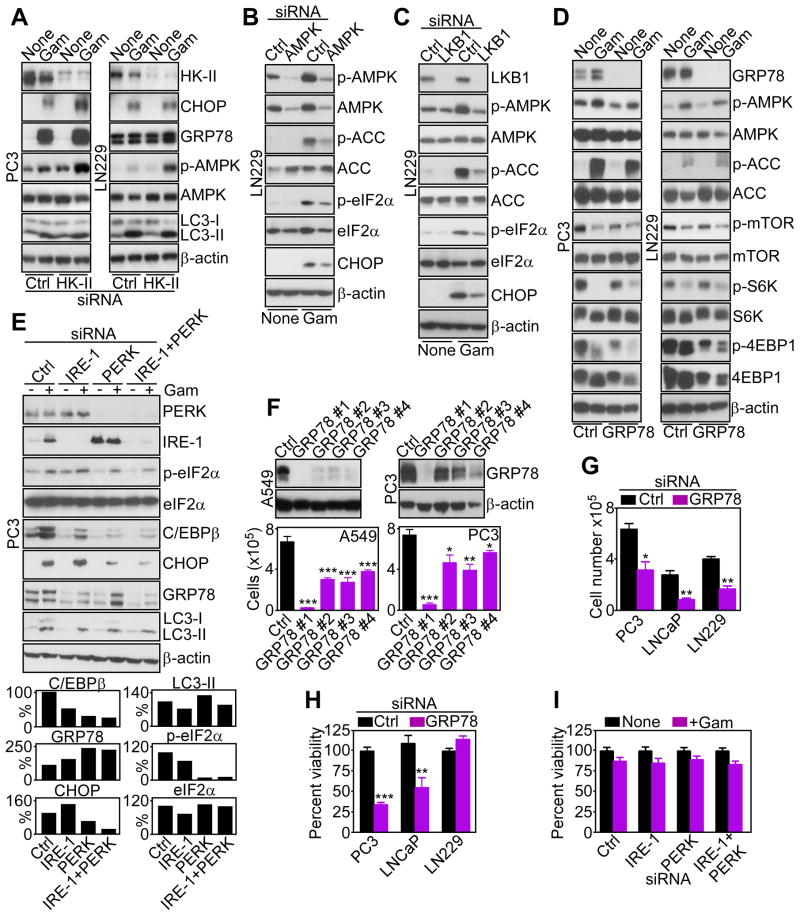
Figure 6. Functional requirements of ER UPR induced by mitochondrial proteotoxic stress.
(A-E) The indicated tumor cell lines were transfected with control siRNA (Ctrl), or siRNA directed to HK-II (A), AMPK (B), LKB1 (C), GRP78 (D), or the ER stress sensors IRE-1 or PERK, alone or in combination (E), incubated in the presence or absence (None) of Gamitrinib (5 μM) and analyzed 24–48 hr after siRNA transfection by Western blotting. Bar graphs (E), densitometric quantification of normalized C/EBPβ, CHOP, GRP78, LC3-II, or phosphorylated eIF2α bands in the presence of Gamitrinib. Basal eIF2α levels in the absence of Gamitrinib were also calculated.
(F) A549 or PC3 cells were transfected with control siRNA (Ctrl) or the indicated individual siRNA sequences to GRP78, and analyzed after 48 hr by Western blotting. Bottom, siRNA-transfected cells as above were analyzed for cell proliferation by direct cell counting. Mean±SEM of three independent experiments. *, p<0.05; **, p<0.01; ***, p<0.001.
(G, H) The indicated tumor cell types were transfected with control siRNA (Ctrl) or GRP78-directed siRNA, and analyzed for cell proliferation by direct cell counting (G), or cell viability by MTT (H). Mean±SEM (n=8, G; n=3, H); *, p=0.016; **, p=0.017–0.0055; ***, p<0.0001.
(I) siRNA-transfected PC3 cells as in (E) were treated in the absence (None) or presence of 5 μM Gamitrinib and analyzed for cell viability by MTT. Mean±SEM of replicates of a representative experiment out of two independent determinations. See also Figure S5.

