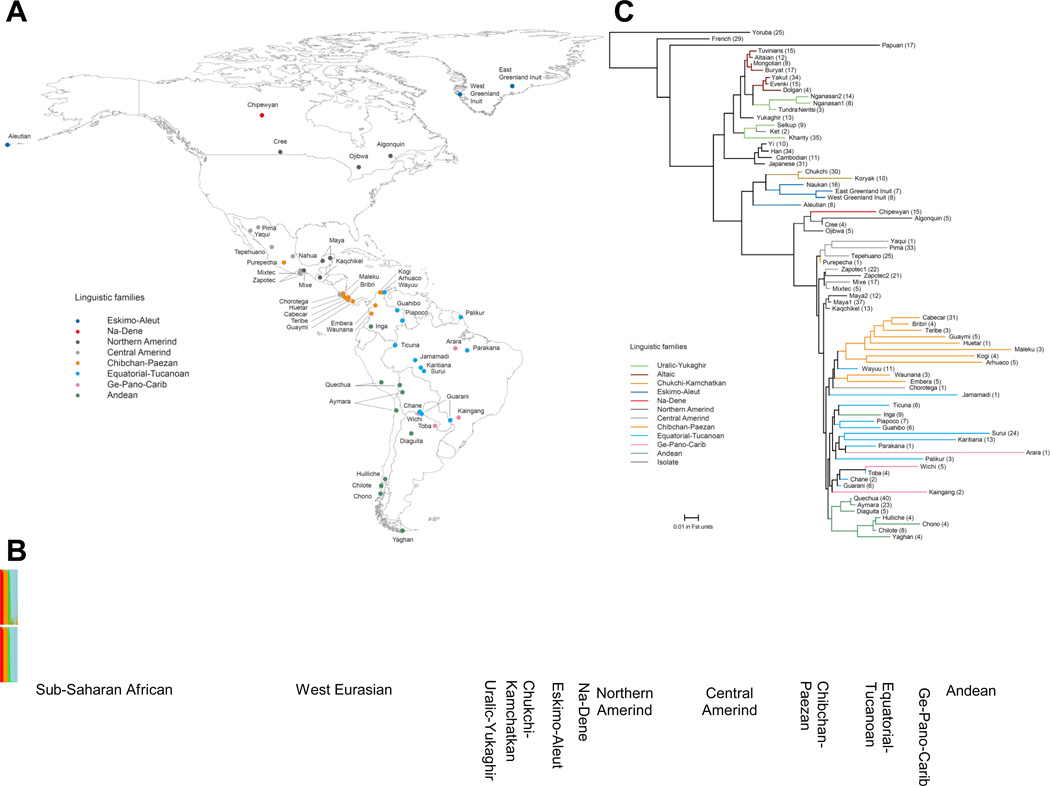
Figure 1. Geographic, linguistic and genetic overview of 52 Native American populations.
(A) Sampling locations of the populations, with colors corresponding to linguistic groups. (B) Cluster-based analysis (k=4) using ADMIXTURE shows evidence of some West Eurasian-related and sub-Saharan-African-related ancestry in many Native Americans prior to masking (top), but little afterward (bottom). Thick vertical lines denote major linguistic groupings, and thin vertical lines separate individual populations. (C) Neighbor-Joining tree based on FST distances relating Native American to selected non-American populations (sample sizes in parentheses). Native American and Siberian data were analyzed after masking but consistent trees were obtained on a subset of completely unadmixed samples (Figure S3). Some populations have evidence for substructure, and we represent these as two different groups (e.g. Maya1 and Maya2).

