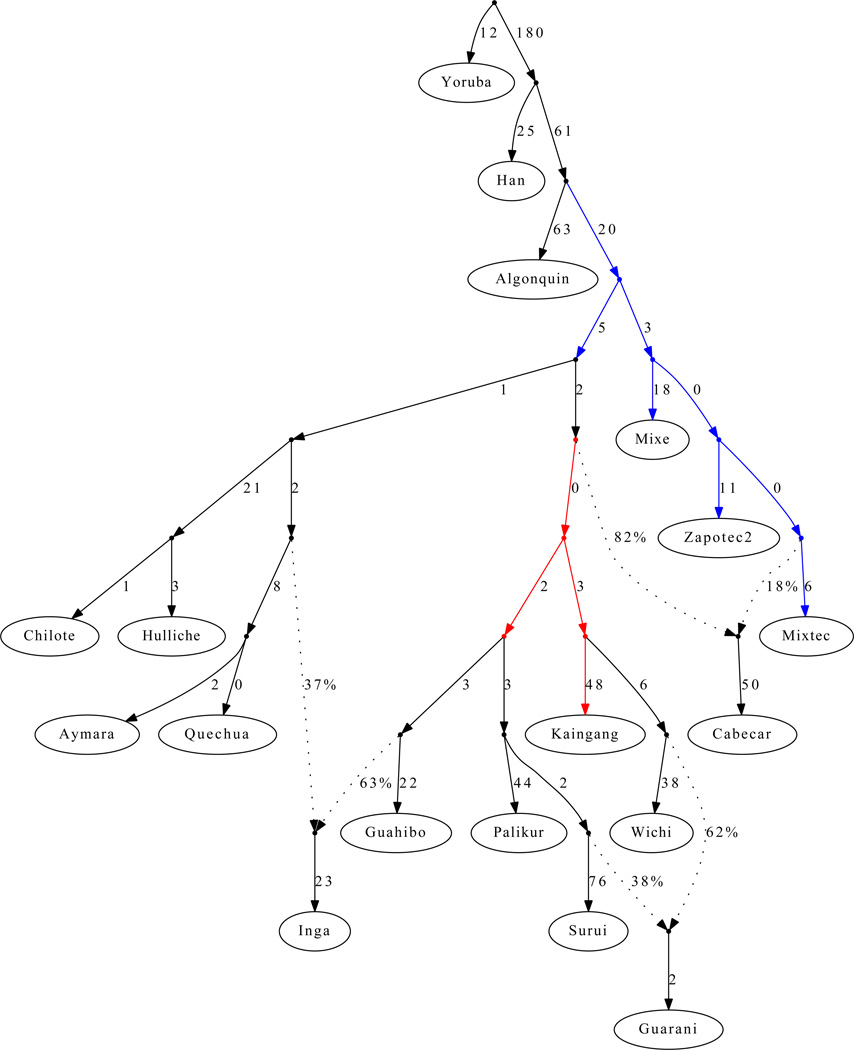
Figure 3. A model fitting populations of entirely First American ancestry.
We show an Admixture Graph (AG) depicting the relationships among 16 selected Native American populations with entirely First American ancestry along with 2 outgroups (Yoruba and Han). The Colombian Inga are modeled as a mixture of Andean and Amazonian ancestry. The Paraguayan Guarani are fit as a mixture of separate strands of ancestry from eastern South America. The Central American Cabecar are modeled as a mixture of strands of ancestry related to South Americans and to North Americans, supporting back-migration from South into Central America. The coloring of edges indicates alternative insertion points for the admixing lineages leading to the Cabecar that produce a similar fit to the data in the sense that the χ2 statistic is within 3.84 of the AG shown. The red coloring shows that the South American lineage contributing to the Cabecar split off after the divergence of the Andean populations, and the blue coloring shows that the other lineage present in the Cabecar diverged before the separation of Andeans.

