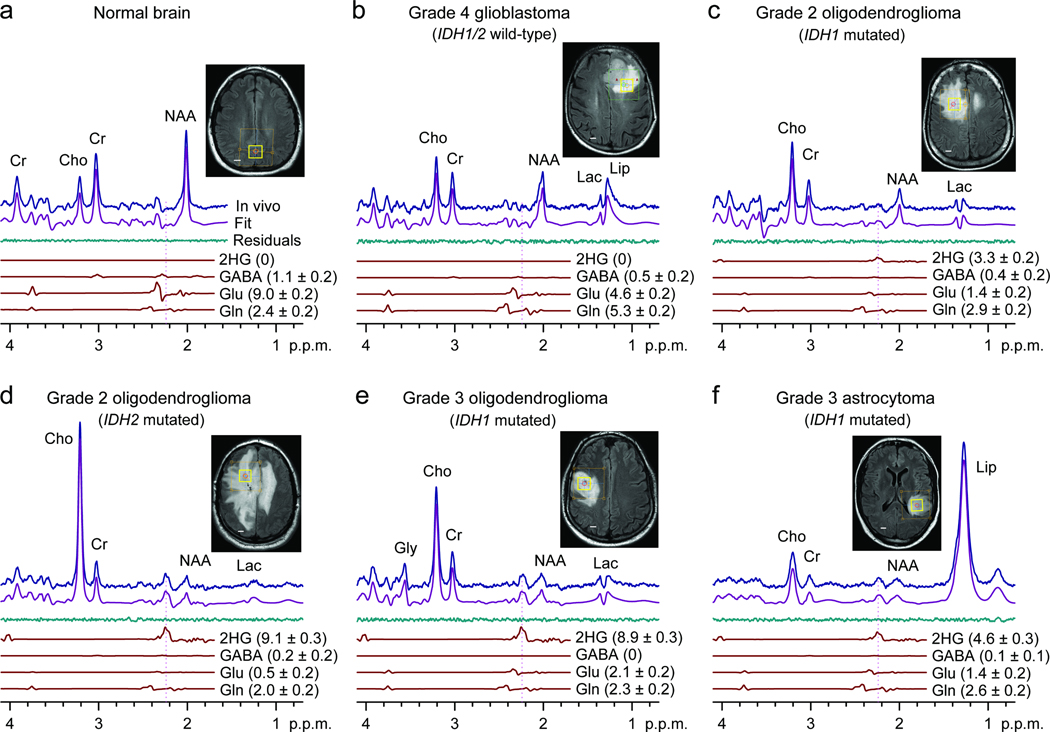
Figure 2.
In vivo single-voxel localized PRESS spectra from normal brain (a) and tumors (b-f), at 3T, are shown together with spectral fits (LCModel) and the components of 2HG, GABA, glutamate, and glutamine, and voxel positioning (2×2×2 cm3). Spectra are scaled with respect to the water signal from the voxel. Vertical lines are drawn at 2.25 p.p.m. to indicate the H4 multiplet of 2HG. Shown in brackets is the estimated metabolite concentration (mM) ± standard deviation. Abbreviations: Cho, choline; Cr, creatine; NAA, N-acetylaspartate; Glu, glutamate; Gln, glutamine; GABA, γ-aminobutyric acid; Gly, glycine; Lac, lactate; Lip, lipids. Scale bars, 1 cm.

