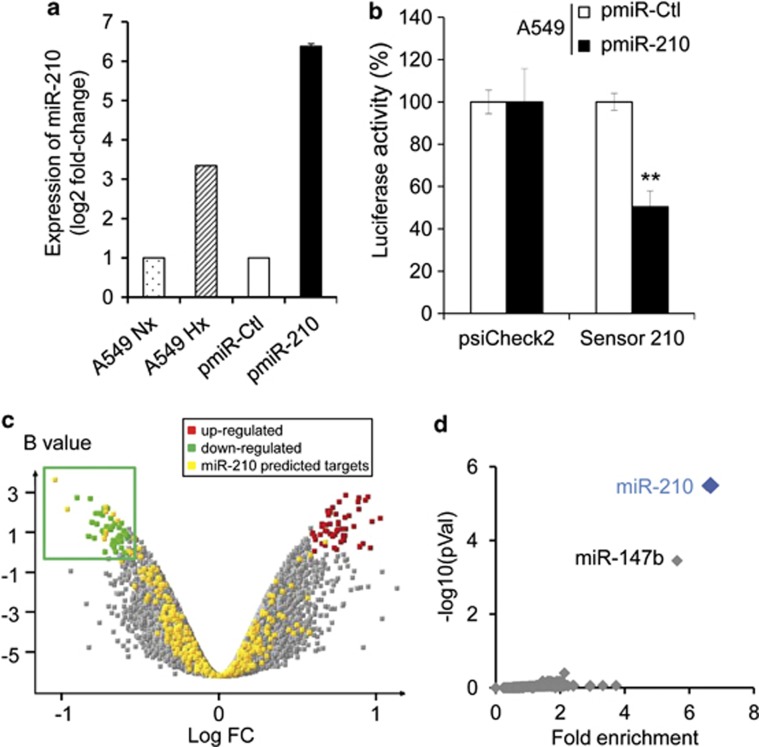
Figure 1.
Identification of a miR-210 transcriptional signature in pmiR-210 A549 cells. (a) MiR-210 expression was analyzed by qRT-PCR on A549 cells cultivated in normoxia or hypoxia (1% O2) and on A549-derived pmiR-Ctrl and pmiR-210 cells. Mean±S.E.M. is representative of three independent experiments carried out in duplicate. (b) Activity of miR-210 was assayed in pmiR-Ctl and pmiR-210 cell lines with a 2 × perfect sensor construct, and were normalized using psiCheck2. Mean±S.E.M. is representative of three independent experiments carried out in triplicate. **P<0.05. (c) Volcano plot showing the distribution of differentially expressed genes between pmiR-210 versus pmiR-Ctl A549 cells. The green window focuses on significantly downregulated transcripts, containing a high proportion of miR-210-predicted targets (yellow dots). (d) Overrepresentation of miR-210-predicted targets in the pmiR-210 cell line according to TargetScan algorithm. Representation of miRNA predicted targets in the set of downregulated genes was compared with the set of all expressed genes. For each miRNA, a fold enrichment value (horizontal axis) and an associated P-value (vertical axis) were calculated. The best enrichment score and P-value are obtained for miR-210. A significant score is also obtained for miR-147b, confirming the close functional proximity of miR-210 and miR-147b11

