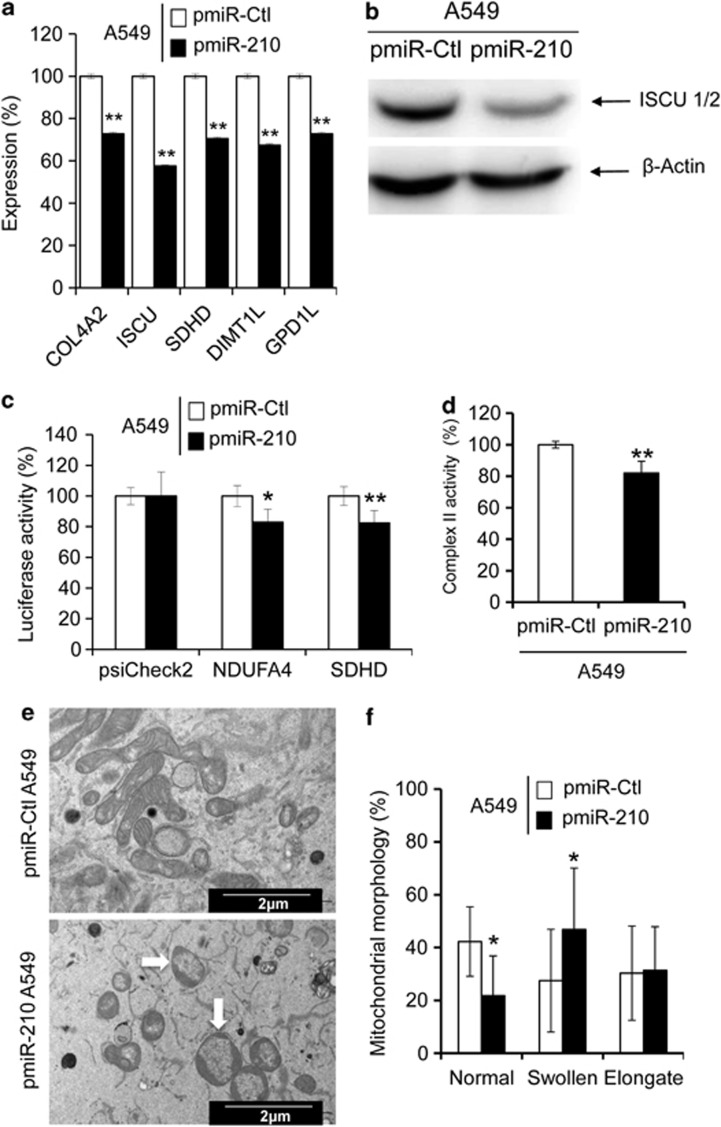
Figure 2.
Mitochondrial functions are altered in pmiR-210 A549 cells. (a) Expression levels of five miR-210 targets (predicted and confirmed) were measured by qRT-PCR in pmiR-Ctl and pmiR-210 A549 cells. Mean±S.E.M. is representative of three independent experiments carried out in triplicate. (b) Western blotting showing downregulation of ISCU1/2 in pmiR-210 cells. Representative blot out of three independent experiments is shown. (c) Effect of miR-210 on NDUFA4 and SDHD was assessed using luciferase reporter assay. NDUFA4 3′-UTR, SDHD 3′-UTR construct or the control construct were transfected into pmiR-Ctl and pmiR-210 A549 cells and assayed for luciferase activity. Renilla luciferase values were normalized to Firefly luciferase activity. Mean±S.E.M. is representative of three independent experiments carried out in triplicate. (d) Complex II activity assays were performed on pmiR-Ctl and pmiR-210 A549 cells 48 h after plating. Mean±S.E.M. is representative of three independent experiments carried out in duplicate. (e) Electron micrograph showing morphology of mitochondria in pmiR-Ctl and pmiR-210 A549 cells. (f) Quantification of mitochondrial morphology. The quantification was done on thirty cells for each cell line. *P<0.01 and **P<0.05

