Figure 3.
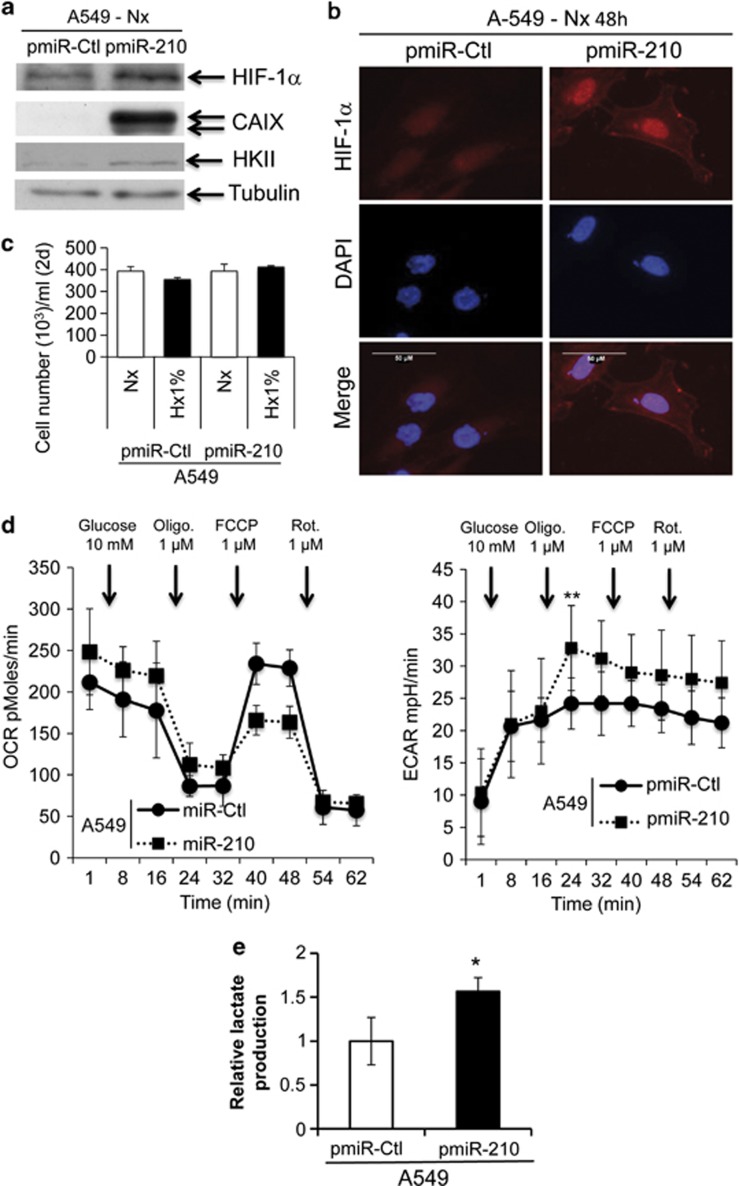
Metabolic characterization of pmiR-Ctl and pmiR-210 A549 cells. (a) Immunoblotting of HIF-1α, CAIX, HKII and tubulin in pmiR-Ctl and pmiR-210 A549 cells in normoxia. (b) Immunofluorescence of HIF-1α in pmiR-Ctl and pmiR-210 A549 cells in normoxia; scale bar, 50 μm. (c) Characterization of the growth of pmiR-Ctl and pmiR-210 A549 cells incubated in normoxia (Nx) or in hypoxia 1% O2 (Hx1%) for 2 days (2d). Mean±S.E.M. is representative of two independent experiments carried out in duplicate. (d) OCR (left panel) and ECAR (right panel) were measured in real time in a Seahorse XF bioenergetic assay. A total of 2 × 10⁴ pmiR-Ctl and pmiR-210 A549 cells were seeded for 2d. Average OCR and ECAR were calculated from at least four measurements during the treatment of each compound (glucose, oligomycin, FCCP, rotenone) at the concentration as indicated. Mean±S.E.M. is representative of six independent experiments carried out in tetraplicate. **P<0.01 shows significant difference from the miR-Ctl after addition of oligomycin. (e) After 2d of culture, cells were lysed in assay buffer by sonication. Then, lactate was quantified in cellular extracts. Lactate quantity is expressed in relative lactate production. Mean±S.E.M. is representative of three independent experiments carried out in duplicate. *P<0.05 shows significant difference from the miR-Ctl

