Figure 4.
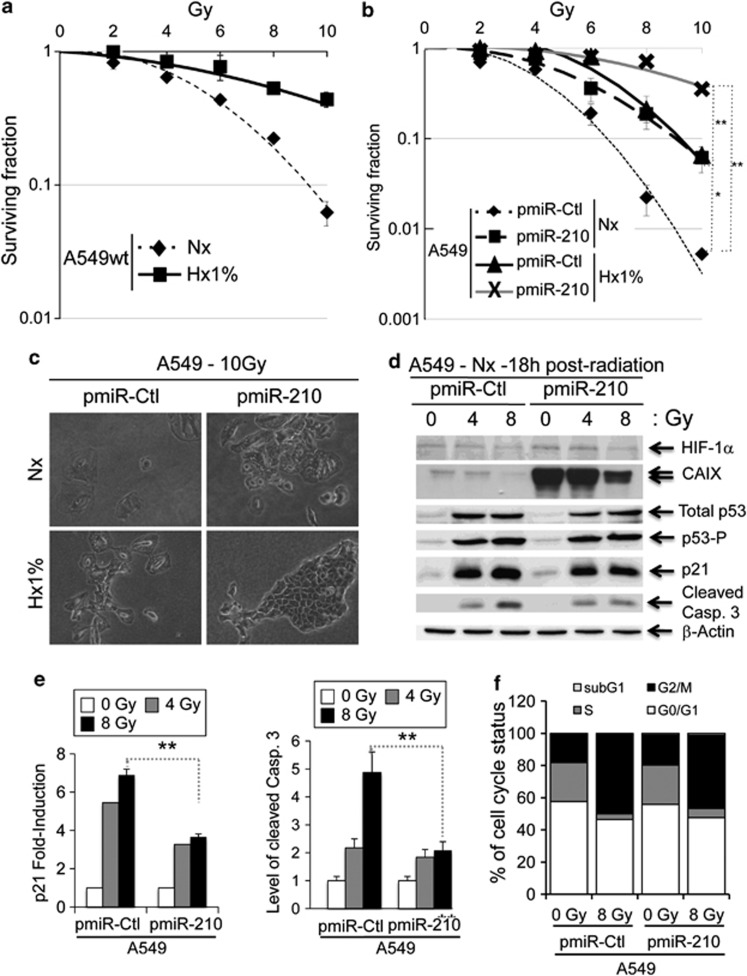
Radioresistance of pmiR-210 A549 cells. (a) Radioresistance of wild-type A549 (A549wt) cells cultured for 2 days in normoxia (Nx) and in hypoxia 1% O2 (Hx1%), and treated with the indicated dose of radiation. Cells were then subjected to a clonogenic cell survival assay. In x axis is the dose of X-radiation. In y axis is the surviving fraction. Mean±S.E.M. is representative of two independent experiments carried out in duplicate. (b) Radioresistance of both pmiR-Ctl and pmiR-210 A549 cells cultured for 2 days in normoxia (Nx) and hypoxia 1% O2 (Hx1%). The cells were then subjected to a clonogenic cell survival assay. In x axis is the dose of X-radiation. In y axis is the surviving fraction. Mean±S.E.M. is representative of three independent experiments carried out in duplicate for a+b. (c) Cell morphology from microscope images of pmiR-Ctl and pmiR-210 A549 cells cultured for 2 days in normoxia (Nx) and hypoxia 1% O2 (Hx1%), treated with 10 Gy and subject to clonogenic cell survival. (d) Immunoblotting of HIF-1α, CAIX, total p53, p53-P, p21, cleaved caspase-3 (cleaved Casp.3) and β-actin in pmiR-Ctl and pmiR-210 A549 cells in normoxia (Nx) 18 h after irradiations (0, 4 and 8 Gy). (e) Histograms show the quantification of the p21 and the cleaved caspase-3 bands. Mean±S.E.M. is representative of three independent experiments. **P<0.01. (f) Eighteen hours after the indicated dose of irradiation, cells were fixed and labeled with propidium iodide for analysis by flow cytometry. Histograms represent the percentage of cells in each phase of the cell cycle (subG1, G0/G1, S and G2/M). Representative results are shown from three independent experiments

