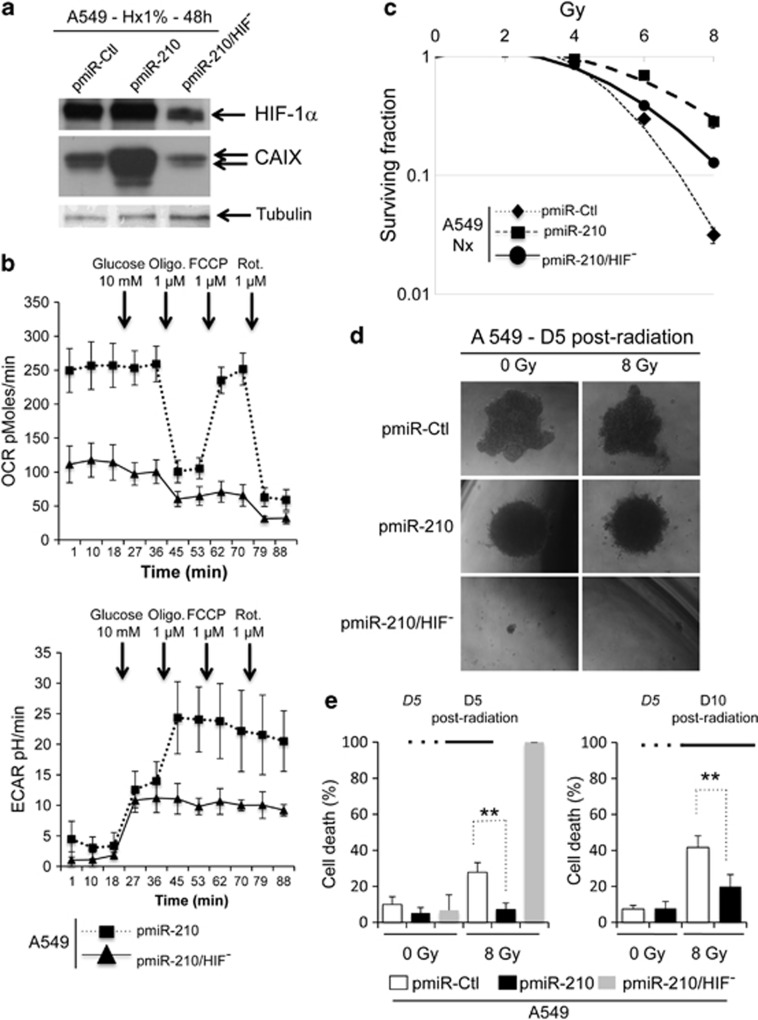
Figure 6.
Involvement of HIF-1α in miR-210 radioresistance. (a) Immunoblot of HIF-1α, CAIX and tubulin in pmiR-Ctl, pmiR-210 and pmiR-210/HIF− A549 cells in hypoxia 1% O2 (Hx1%). (b) OCR (top panel) and ECAR (bottom panel) were measured in real time in a Seahorse XF bioenergetic assay. A total of 2 × 10⁴ pmiR-210 and pmiR-210/HIF− A549 cells were seeded for 2 days. Average OCR and ECAR were calculated from at least four measurements during the treatment of each compound (glucose, oligomycin, FCCP, rotenone) at the concentration as indicated. Mean±S.E.M. is representative of three independent experiments carried out in tetraplicate. (c) Radioresistance of both pmiR-210 and pmiR-210/HIF− A549 cells cultured for 2 days in normoxia (Nx). The cells were then subjected to a clonogenic cell survival assay. In x axis is the dose of X-radiation. In y axis is the surviving fraction. Mean±S.E.M. is representative of three independent experiments carried out in duplicate. (d and e) A549 cells, pmiR-Ctl, pmiR-210 and pmiR-210/HIF−, were cultured as 3D spheroids for 5 days (D5), subjected to 0 or 8 Gy, and then cultured for 5 (D5) or 10 (D10) days. Spheroids were then subjected to accutase dissociation, and individualized live cells and dead cells were counted using Trypan blue. Data represent the average of three independent experiments. **P<0.01

