Figure 7.
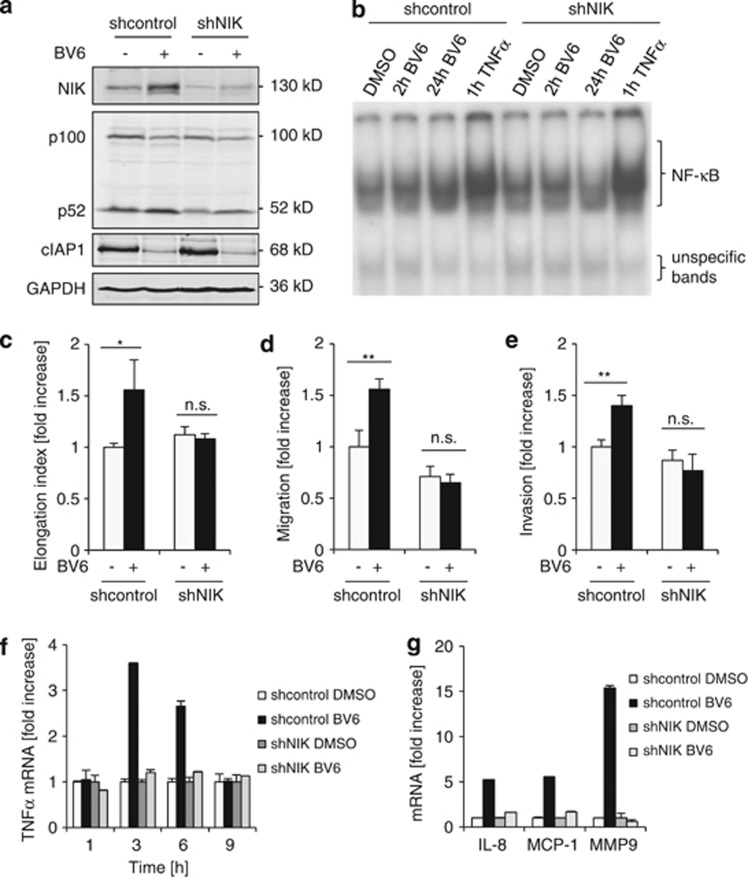
NIK is required for BV6-induced cell elongation, migration and invasion. (a) T98G cells transduced with shRNA against NIK or vector control were treated for 24 h with 2.5 μM BV6. Expression levels of NIK, p100, p52 and cIAP1 were analyzed by western blotting. Expression of GAPDH served as loading control. (b) T98G cells transduced with shRNA against NIK (shNIK) or vector control were treated for 2 and 24 h with 2.5 μM BV6, stimulation with 10 ng/ml TNFα for 1 h was used as positive control. Nuclear extracts were prepared and analyzed for NF-κB DNA-binding activity by EMSA. NIK knockdown slightly reduced BV6-stimulated NF-κB DNA-binding after treatment with BV6 for 24 h compared with non-silencing control cells. (c–e) T98G cells transduced with shRNA against NIK or vector control were treated for 24 h with 2.5 μM BV6. Cell morphology was analyzed by phase-contrast microscope. Cell elongation was quantified by measuring cell length and width and by calculating cell elongation index (length/width); fold increase in elongation index is shown (c). Migrated cells were fixed and stained with crystal violet. Migration was quantified by dissolution of crystal violet staining and determination of optical density (d). Cells were allowed to invade in a collagen-coated transwell migration chamber; invasive cells were fixed, stained with crystal violet and optical density was measured (e). (f) T98G cells transduced with shRNA against NIK or vector control were treated for indicated times with 2.5 μM BV6. TNFα mRNA levels were analyzed by quantitative RT-PCR and fold increase in TNFα mRNA levels is shown. (g) T98G cells transduced with shRNA against NIK or vector were treated with 2.5 μM BV6. mRNA levels of indicated NF-κB target genes were analyzed by quantitative RT-PCR and are shown as fold increase for maximal induction (IL-8 and MCP-1 after 6 h, and MMP9 after 24 h). In (a and b), representative experiments from two (a) or three (b) experiments are shown. In (c–g), mean+S.D. values of three (c–e) or two (f and g) independent experiments performed in triplicate (c, f and g) and duplicate (d and e) are shown; *P<0.05; **P<0.01; n.s. not significant

