Figure 6.
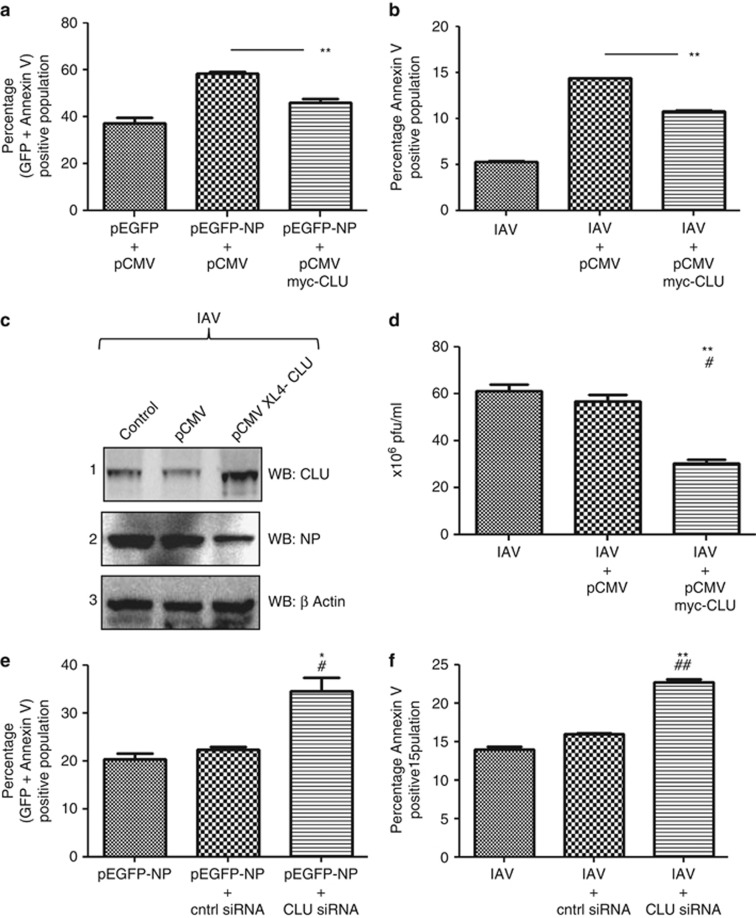
CLU attenuates IAV NP-induced cell death and IAV replication. (a) A549 cells were transfected with CLU-expressing plasmid pCMV XL4-CLU or control plasmid pCMV. Twenty-four hours post-transfection, cells were transfected with pEGFP-NP plasmid or pEGFP control plasmid. Cells were harvested at 24 h postinfection, stained with Annexin V PE and subjected to flow cytometry. The percentage of (GFP+Annexin V) positive population was plotted on the graph. (b) A549 cells were transfected with CLU-expressing plasmid pCMV XL4-CLU or control plasmid pCMV. Twenty-four hours post-transfection, cells were infected with A/California/08/2009(H1N1) IAV at 0.2 MOI. Cells were harvested at 12 h postinfection, stained with Annexin V PE and subjected to flow cytometry. The percentage of Annexin V-positive population was plotted on the graph. (c) A549 cells were transfected with CLU-expressing plasmid pCMV XL4-CLU or control plasmid pCMV. Twenty-four hours post-transfection, cells were infected with A/California/08/2009(H1N1) IAV at 0.2 MOI. Cells were harvested at 24 h postinfection, and the cell lysates were subject to SDS-PAGE followed by western blotting with antibodies specific to CLU, NP and β actin, which are shown in panels 1, 2, and 3 respectively. Lane 1 shows control cells, lane 2 shows cells transfected with control plasmid and lane 3 shows cells transfected with CLU-expressing plasmid, all of which are infected with IAV. (d) Culture supernatant from the experiment shown in (c) were harvested and used to set up plaque assay to study virus replication. The 106 × pfu/ml was plotted on the graph. (e) A549 cells were transfected with siRNA pool against CLU gene or nontargeting control siRNA. Twenty-four hours post-transfection, cells were transfected with pEGFP-NP plasmid. Twenty-four hours postinfection cells were harvested and stained with Annexin V PE and subjected to flow cytometry. The percentage of (GFP+Annexin V) positive population was plotted on the graph, * and #indicate P values compared to pEGFP-NP and pEGFP-NP+control siRNA samples respectively. (f) A549 cells were transfected with siRNA pool against CLU gene or nontargeting control siRNA. Twenty-four hours post-transfection; cells were infected with A/California/2009(H1N1) IAV at 0.2 MOI. Twelve hours postinfection cells were harvested and stained with Annexin V PE and subjected to flow cytometry. The percentage of Annexin V-positive population was plotted on the graph. All graphs represent mean±S.D. of one representative experiment (n=3). Statistical significance was determined using Student's t-test. *P<0.05; **P<0.01, * and #indicate P values compared to IAV only and IAV+control siRNA treated samples respectively

