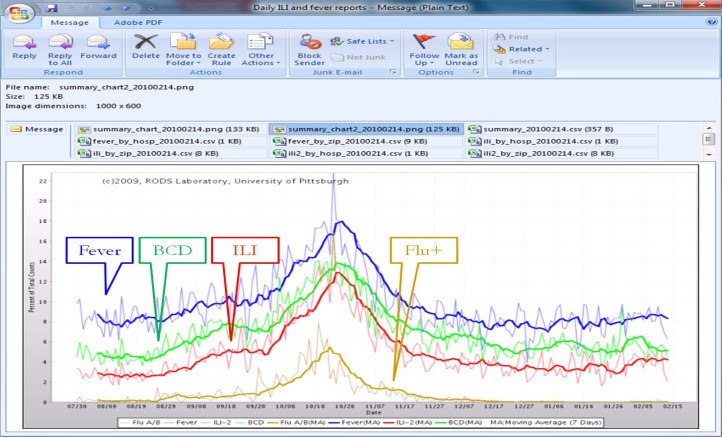
Figure 2:
Influenza and ILI summary chart for February 15, 2010 (showing data from Aug. 1, 2009 to Feb. 14, 2010) in a daily email report to the Allegheny County Health Department. It comprises daily fever counts (from NLP), accumulated influenza posterior probability counts from Bayesian CDS, ILI counts (from NLP), and influenza (flu) test positive counts.

