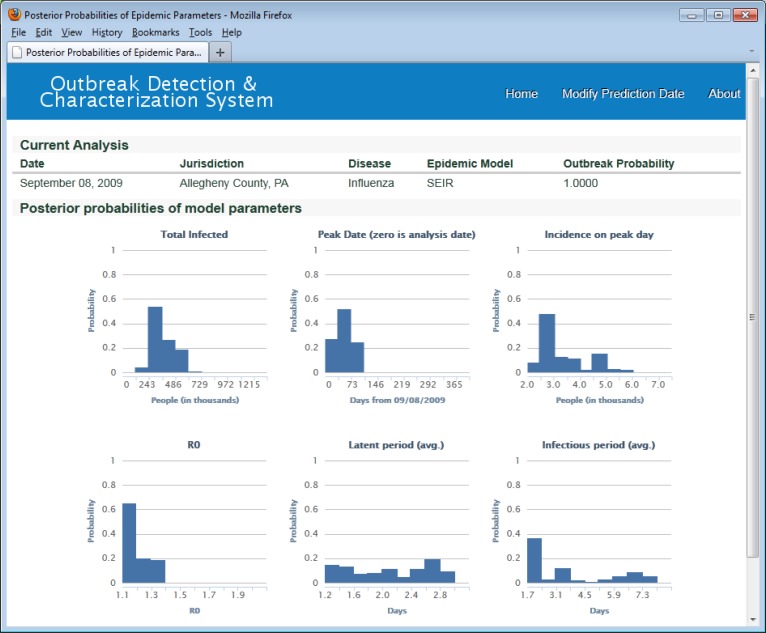
Figure 3.
Distributions of total infected, peak date, incidence on peak day, and posterior distributions for Ro, latent period, and infectious period. ODS used uniform prior probabillity distributions for SEIR model parameters in this analysis. For example, the prior distribution for Ro was uniform over the range 1.1 to 1.9.

