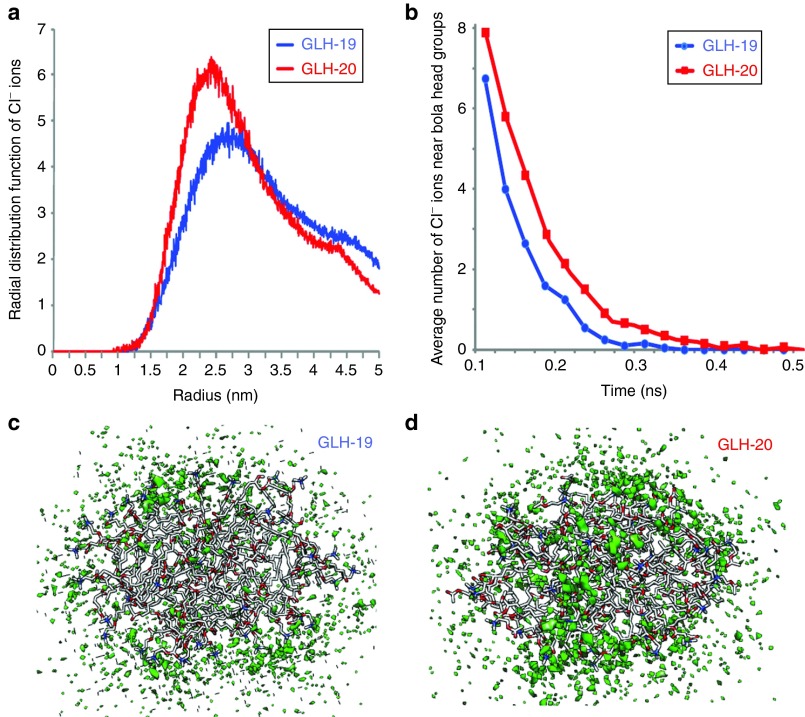
Figure 3.
Chloride ion distribution around GLH-19 and GLH-20 micelles. (a) Radial distribution functions of Cl− ions from the center of the GLH-19 and GLH-20 micelles. (b) Average number of Cl− ions within a 7 Å range from each bolaamphiphile head group during 0.5 ns time range. 3D density plots of Cl− ions (green) around (c) GLH-19 and (d) GLH-20 micelles. ns, nanoseconds.

