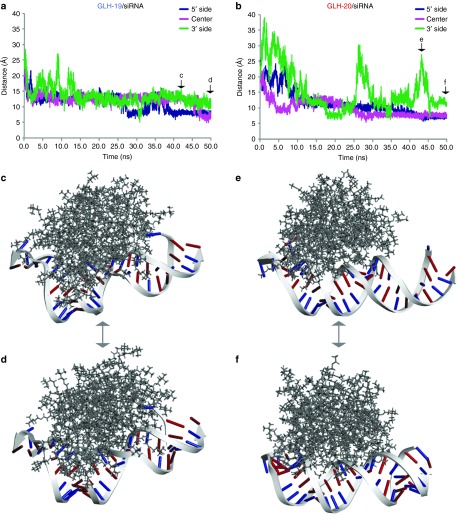
Figure 4.
The distance measurement between the phosphates of C3 (5′-side of the sense strand), U14 (middle), and G25 (3′ side of the sense strand) of the siRNA and the nearest bolaamphiphile head groups of (a) GLH-19 and (b) GLH-20. The initial time points (0 ns) were chosen after the equilibration heating of the system. Snapshots of the GLH-19/siRNA complex (c) at 43 ns and (d) at 50 ns and snapshots of the GLH-20/siRNA complex (e) at 43 ns and (f) at 50 ns taken from corresponding MD trajectories (also see Supplementary Videos S1 and S2). Types of bases in the siRNA are color-coded (purines are in red and pyrimidines are in blue). The siRNA on the GLH-19 micelle surface experienced more deformation than that of GLH-20. ns, nanoseconds.

